Download
1 / 23
230 likes | 365 Views
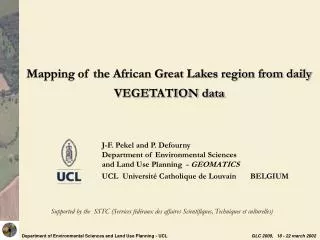
Department of Environmental Sciences and Land Use Planning - UCL GLC 2000, 18 - 22 march 2002. Mapping of the African Great Lakes region from daily VEGETATION data. J-F. Pekel and P. Defourny Department of Environmental Sciences and Land Use Planning - GEOMATICS

E N D
Department of Environmental Sciences and Land Use Planning - UCLGLC 2000, 18 - 22 march 2002 Mapping of the African Great Lakes region from daily VEGETATION data J-F. Pekel and P. Defourny Department of Environmental Sciences and Land Use Planning - GEOMATICS UCL Université Catholique de Louvain BELGIUM Supported by the SSTC (Services fédéraux des affaires Scientifiques, Techniques et culturelles)
Department of Environmental Sciences and Land Use Planning - UCLGLC 2000, 18 - 22 march 2002 • Main challenge for VGT time series data interpretation • How to use simultaneously : • multispectral information • temporal information • full spatial resolution consistency
Study area Window: 4°N-14°S / 25°E-35°E Area: 2.257.920Km² Department of Environmental Sciences and Land Use Planning - UCLGLC 2000, 18 - 22 march 2002
Particularities of the study area 09 07 11 10 08 13 09 15 16 12 14 Department of Environmental Sciences and Land Use Planning - UCLGLC 2000, 18 - 22 march 2002 • Clouds and large gaps 06 may 2000 (Blue, Red, NIR)
Particularities of the study area Department of Environmental Sciences and Land Use Planning - UCLGLC 2000, 18 - 22 march 2002 • Topography
Particularities of the study area Department of Environmental Sciences and Land Use Planning - UCLGLC 2000, 18 - 22 march 2002 • Inversion of seasonality Spatial consistency ? 3 july 2000 (R, PIR, MIR) 6 mars 2000 (R, PIR, MIR)
Compositing Department of Environmental Sciences and Land Use Planning - UCLGLC 2000, 18 - 22 march 2002 1st Strategy:Manual compositing
Compositing Department of Environmental Sciences and Land Use Planning - UCL GLC 2000, 18 - 22 march 2002 2nd Strategy:Mean compositing Annual
Compositing Department of Environmental Sciences and Land Use Planning - UCL GLC 2000, 18 - 22 march 2002 2nd Strategy:Mean compositing Feb-March-April July-August-September Annual
Classification methodology R Seasonal mean (Feb-March-April) NIR MIR Mean reflectance per class R NIR MIR Seasonal mean (July-August-September) Department of Environmental Sciences and Land Use Planning - UCLGLC 2000, 18 - 22 march 2002 Classification (50 classes) Annual mean
Classification Department of Environmental Sciences and Land Use Planning - UCLGLC 2000, 18 - 22 march 2002 R NIR MIR Classification (17 classes) Mean reflectance per class R NIR MIR
Labelling Department of Environmental Sciences and Land Use Planning - UCLGLC 2000, 18 - 22 march 2002 Classe 1: forêt dense humide semprevirente et semi-décidue Classe 2: forêt dense humide semi-décidue Classe 3: forêt ombrophile secondaire
Labelling Department of Environmental Sciences and Land Use Planning - UCLGLC 2000, 18 - 22 march 2002
Validation: visual comparison Department of Environmental Sciences and Land Use Planning - UCLGLC 2000, 18 - 22 march 2002 Landsat TM (Nir, MIR, Green) Classification result of VEGETATION data
Validation: visual comparison Department of Environmental Sciences and Land Use Planning - UCLGLC 2000, 18 - 22 march 2002 Classification result of VEGETATION data Landsat TM (Nir, MIR, Green)
Validation: visual comparison Department of Environmental Sciences and Land Use Planning - UCLGLC 2000, 18 - 22 march 2002 Landsat TM (Ni r, MIR, Green) Classification result of VEGETATION data
Validation: visual comparison Department of Environmental Sciences and Land Use Planning - UCLGLC 2000, 18 - 22 march 2002 Landsat TM (Nir, MIR, Green) Classification result of VEGETATION data
Validation: visual comparison Department of Environmental Sciences and Land Use Planning - UCLGLC 2000, 18 - 22 march 2002 Classification result of VEGETATION data Landsat TM (Nir, MIR, Green)
Validation: visual assesment Department of Environmental Sciences and Land Use Planning - UCL GLC 2000, 18 - 22 march 2002 Primary forest Secondary forest Roads
Validation: visual comparison Department of Environmental Sciences and Land Use Planning - UCLGLC 2000, 18 - 22 march 2002 Classification result of VEGETATION data TREES map
Validation: visual comparison Department of Environmental Sciences and Land Use Planning - UCLGLC 2000, 18 - 22 march 2002 Classification result of VEGETATION data Landsat TM (Nir, MIR, Green) TREES map (2000)
Validation: visual comparison Department of Environmental Sciences and Land Use Planning - UCLGLC 2000, 18 - 22 march 2002 Classification result of VEGETATION data Landsat TM (Nir, MIR, Green) TREES map (2000)
Conclusions Department of Environmental Sciences and Land Use Planning - UCL GLC 2000, 18 - 22 march 2002 • Automatic and operational methodology of mapping • Use of all reflectance channels and not only the NDVI • High local contrast between land cover types • Mean compositing provides a large spatial consistency • Methodology based on phenology • Methodology most probably applicable to many areas and various conditions