Download
1 / 137
1.37k likes | 1.4k Views
Learn about PBS Program to teach desired behavior, reduce negative behavior, and improve school environment and academic performance. Implement interventions based on student needs for a successful outcome.

E N D
PBISPositive Behavioral Supports Marty Smith, Director Behavior Institute of Georgia Sponsored by Burke County Schools
What’s it Called??? • PBS – Positive Behavioral Support • PBIS – Positive Behavior Interventions & Supports • SW-PBS – School-wide Positive Behavioral Support • EBIS – Effective Behavioral & Instruction Supports (Everyone Behaves in School) • PBSIS – Positive Behavior Supports in Schools
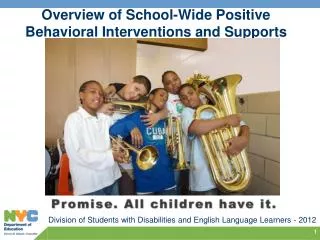
What is PBS? • A program to teach all students desired behavior in the school setting • A prevention program to reduce undesirable behavior • A framework that each school individualizes to meet their specific student and staff populations, problems, and celebrate successes • Schools use office discipline referral (ODR) data and surveys to identify problems, to plan, implement, and evaluate solutions
What to Expect: • For the commitment & implementation of PBS:- A decrease of 40-60% in ODRs in the next 3-5 years- Improved relationships with parents and community partners- A cohesive staff with a vision for improvement in student academic achievement - An environment where teachers can teach and students can learn
“It’s definitely a change of tactics, but the over-all strategy remains the same.”
PBS A structured approach to creating an effective school-wide discipline program to move away from QUIT – STOP – DON’T
Academic Systems Behavioral Systems • Intensive, Individual Interventions • Individual Students • Assessment-based • High Intensity • Intensive, Individual Interventions • Individual Students • Assessment-based • Intense, durable procedures • Targeted Group Interventions • Some students (at-risk) • High efficiency • Rapid response • Targeted Group Interventions • Some students (at-risk) • High efficiency • Rapid response • Universal Interventions • All students • Preventive, proactive • Universal Interventions • All settings, all students • Preventive, proactive Designing School-Wide Systems for Student Success 1-5% 1-5% 5-10% 5-10% 80-90% 80-90%
Using Positive Behavior Supports to… Develop a Continuum of Interventions for Behavior and Discipline.
Why A Continuum to AddressDiscipline & Behavior? • Over-reliance on the “local expert” • Build a knowledge base of interventions that interfaces with the Student Code of Conduct • Create school based behavioral team competence, Ex. Grade level teams • Early intervention – move away from the Wait to Fail model
All Students in School Students with Dangerous problem behavior (1-2%) Students with chronic/serious problem behavior (3-7%) Students at risk for problem behaviors (5-15%) Students with mild or no behavior problems (80-85%) Adapted from Crone & Horner, Building PBSS in Schools, Guilford
All Students in School Students with Dangerous problem behavior (1-2%) Students with chronic/serious problem behavior (3-7%) Students at risk for problem behaviors (5-15%) Students with mild or no behavior problems (80-85%)
All Students in School Students with Dangerous problem behavior (1-2%) Students with chronic/serious problem behavior (3-7%) Students at risk for problem behaviors (5-15%) Analysis of School Behavior Data Universal Interventions Students with mild or no behavior problems (80-85%)
Analysis of School Datato Establish Interventions • In school suspensions • Out of school suspensions, expulsions • Students referred to SST for behavior • Attendance • School Health Survey (MS, HS) • Variables include: # of students, by month, by teacher, by location, by grade
4% 9% 87% National Technical Center on Positive Behavior Interventions & Supports, 2004
# All % All # Major % Major # Minor % Minor Students with 0 Referrals 283 78.61 % 284 78.89 % 354 98.33 % Students with 1 Referrals 34 9.44 % 36 10.00 % 6 1.67 % Students with 0 or 1 Referrals 317 88.06 % 320 88.89 % 360 100.00 % Students with 2-5 Referrals 37 10.28 % 35 9.72 % 0 0.00 % Students with 6+ Referrals 6 1.67 % 5 1.39 % 0 0.00 % Students with 9+ Referrals 0 0.00 % 0 0.00 % 0 0.00 % Triangle Data Report
9% 16% 75% National Technical Center on Positive Behavior Interventions & Supports, 2004
# All % All # Major % Major # Minor % Minor Students with 0 Referrals 499 53.77 % 499 53.77 % 928 100.00 % Students with 1 Referrals 160 17.24 % 160 17.24 % 0.00 % Students with 0 or 1 Referrals 659 71.01 % 659 71.01 % 928 100.00 % Students with 2-5 Referrals 196 21.12 % 196 21.12 % 0.00 % Students with 6+ Referrals 73 7.87 % 73 7.87 % 0.00 % Students with 9+ Referrals 22 2.37 % 22 2.37 % 0.00 % Triangle Data Report
Sample Continuum of Interventions for Behavior & Discipline SpEd SST: FBA – BIP Behavior Specialists Behavior Education Program Simple FBA - BIP Targeted Social Skills Instruction Student Assistance Programs Mental Health Counseling – In School Programs PBIS Schoolwide Discipline School Climate/School Health Survey Bullying Prevention Programs Safe & Drug Free Schools & Communities Programs Family & Community Involvement Mental Health Services
Activity #1 • Examine the example pyramids • Determine what interventions are in place at each tier • What data are available to design additional interventions? • What procedures are in place for students to access interventions? • Discussion and summarize for brief presentation to group
All Students in School Students with Dangerous problem behavior (1-2%) Students with chronic/serious problem behavior (3-7%) Students at risk for problem behaviors (5-15%) Students with mild or no behavior problems (80-85%)
PBS Implementation Includes: • Proactive systems approach (NOT a curriculum) • A framework designed to be responsive to current social and educational challenges • Focus on prevention • Focus on instruction • Incorporates empirically validated practices
Components of a PBS Schoolwide Discipline Plan • Common & consistent approach • Set of expected positive behaviors across environments • Procedures for teaching expectations • Continuum of procedures to encourage expected behaviors & discourage inappropriate behaviors • On-going monitoring of the plans effectiveness
Common & Consistent Approach • Discipline procedures are implemented consistently by staff and administration • Practices move away from the over reliance on punishers
Set of Expected Positive Behaviors Across Environments • Expectations for student behavior are defined by a building based team with input from all staff • Staff incorporate expectations into culture of the school
Appropriate student behavior is taught • Procedures for teaching expectations • Behavioral support strategies are designed to meet the needs of ALL students
Continuum of procedures to encourage expected behaviors & discourage inappropriate behaviors • Positive behaviors are publicly acknowledged • Problem behaviors have clear consequences
On-going monitoring of the plans effectiveness • Student behavior is monitored and staff receive regular feedback • Leadership teams meet regularly/school & district events
Take Home Message • A variety of resources must be tapped to develop a responsive pyramid for behavior • Early intervention is the key • Effective and efficient resolution for problems is critical • Empower staff to seek assistance
Activity #2 • Please complete your Team Member Rating Form – Benchmarks of Quality • School name for “person completing survey” • Complete independently • Complete honestly • Team review all BOQs • Discussion and summarize for brief presentation to group
5 Steps to PBS Success • Step 1 Establish a Leadership Team • Step 2 Secure Staff Buy-in • Step 3 Establish a Data-Based Action Plan • Step 4 Arrange for High Fidelity Implementation • Step 5 Conduct Formative Data Based Monitoring of PBS
PBIS Social Competence & Academic Achievement Supporting Decision Making OUTCOMES Supporting Staff Behavior SYSTEMS DATA PRACTICES Supporting Student Behavior
Practices, Systems, & Data • Practices • Define, Teach, Monitor, Model, & Reinforce expected behavior • Correct behavioral errors • Systems • Administration leaders/supporters • Implementation is Team-based • Budgeted support • Defined commitment • Data • Purposeful information used to make data-based decisions
Does PBIS Work? When used as part of school-wide systems have observed a 50-60% REDUCTION in ODRs(Horner, Sugai, & Todd, 2001)
Does PBIS Work? See increases in time spent in academic instruction as opposed to time spent in detention Year 1 No PBIS Year 2 PBIS
Does PBIS Work? Cost Effectiveness • Elementary School (N=808, K-6) • 2002-2003=1457(baseline pre-PBIS) • 2003-2004=1135 • 22% reduction • 2004-2005=746 • 49% reduction from baseline • 2005-2006=294 • 80% reduction from baseline
YES!! YEAH!!!! Our hard work is paying off! Based on an average of 15 minutes per referral, administration saved 17,445 minutes or 290 HOURS or 36 DAYS of time!
Does PBIS Work? Cost Effectiveness • Middle School (N=1,257; 6-8) • 2002-2003=3258(baseline pre-PBIS) • 2003-2004=2720 • 17% reduction • 2004-2005=1398 • 57% reduction from baseline • 2005-2006=694 • 79% reduction from baseline
YES!!! YEAH!!!! Our hard work is paying off! Based on an average of 15 minutes per referral, administration saved 38,460 minutes or 641 HOURS or 80 DAYS of time!
Elementary School Example • K-5 • 593 students • Urban area • Title One • Did not make AYP
Percent ODR Change Baseline to Year 1 55% DECREASE Baseline to Year 2 71% DECREASE Time Saved Baseline to Year 2 67.75 hours SAVED 8.47 School days SAVED Elementary School Example