Download
1 / 48
490 likes | 699 Views
Ecology and Humans. Chapters 3, 4 (up to biomes), 5, 8. Levels of Organization in Ecology. Ecology is the study of interactions among organisms and between organisms and their environment Species/Organisms

E N D
Ecology and Humans Chapters 3, 4 (up to biomes), 5, 8
Levels of Organization in Ecology • Ecology is the study of interactions among organisms and between organisms and their environment • Species/Organisms • Populations: in population ecology, scientists study the dynamics of population change and the factors that affect distribution/abundance of organisms (Chapter 3) • Communities: in community ecology, scientists study patterns in species diversity and all interactions (Chapter 4) • Ecosystems: in ecosystem ecology, scientists study the flow of energy and nutrients, both the living and non-living components of a system (Chapter 5) • Biomes • Biosphere
Population Ecology in population ecology, scientists study the dynamics of population change (natural selection and evolution)and the factors that affect distribution/abundance of organisms (Chapter 3)
Evolution and Natural Selection • How are these two terms different? • Darwin versus Wallace • Evolution (mutation) leads to adaptation and adaptive traits in a population • Changes can result in no change, positive change, or negative change • Natural selection acts on changes • Selection can be • Directional • Stabilizing • Disruptive • Take a minute to draw a sketch of these three trends
Evolution and Natural Selection • The environment can influence selection • Convergent Evolution • Divergent Evolution • Selection can be seen in our everyday lives • Ex: Breeding in dogs, artificial selection in plants • Biological diversity is a result of evolution • 100 million species in world
Speciation • Generation of new species can occur in several ways • Allopatric Speciation (main mode) • Sympatric Speciation (sym….same)
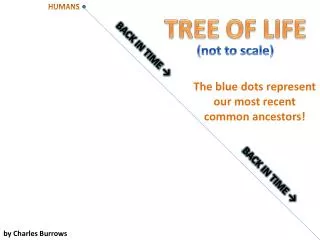
Fossils and Extinction • Fossils can show us many things • Existence of life on Earth for 3.5 B years • Evolution of organisms • Number of exiting species generally increases • Most species are now extinct • Several mass extinctions have occurred • Background extinction rate • 6th mass extinction is occurring now • Phylogenetic trees can be used to trace the divergence of organisms
Resources needed by organisms • Habitat • Habitat use • Habitat selection • Niche • Specialists versus Generalists • Fundamental niche versus realized niche
Characteristics of populations • The following characteristics can be used to predict the future dynamics of a population • Population Size • Population Density • What are the advantages of high/low density? • Population Distribution • Random, Uniform, Clumped • Take a minute, to sketch a diagram of these three distributions and an example of each • Sex Ratio • Age Structure • Birth and Death Rates • Can be used to develop survivorship curves
Survivorship Curves • Take a minute to graph Type I, II, and III survivorship curves and list an example of species of each curve, note which are K-selected and which are R-selected • Growth is determined by • Births (natality) • Deaths (mortality) • Immigration • Emigration • How can you calculate the natural rate of population growth? • How can you calculate the population growth rate?
Factors that influence population growth • Exponential growth is seen in populations that grow by a fixed percent each year • Take a second to sketch a graph of this type of curve and give an example of an organism • In reality, limiting factors will prevent a population from growing forever, this type of scenario is shown in a logistic growth curve • Populations rise sharply at first, but them begin to level off as limiting factors become stronger, the force of these factors is called the environmental resistance and stabilizes the population at its carrying capacity • Take a second to sketch a graph of this type of curve and give an example of an organism • Density-dependent factors versus density-independent factors; both can be limiting factors and create variations in a growth curve • Carrying capacity is not set in stone
Community Ecology in community ecology, scientists study patterns in species diversity and all interactions (Chapter 4); changes in populations can influence the composition of the community
How do species interact? • Competition (- -) • Intraspecific versus Interspecific • Competitive exclusion or species coexistence • Resource partitioning and character displacement: role of natural selection • Predation, Parasitism (*S), Herbivory (+ -) • Predation can drive cyclical population dynamics, take a second to graph this type of relationship and give an example • Coevolution, evolutionary arms race • Mutualism (*S) (+ +) • Mycorrhizae • Digestion • Amensalism (- 0) • Commensalism (*S)(+ 0) *S=Symbiosis: a close relationship between two organisms
Energy flows through ecosystems • Types of organisms: producers, consumers, detrivores, decomposers • Trophic level: literally means feeding level, traced through food web or food chain • Energy, biomass and number of organisms decrease a higher trophic levels
10% Rule 1) The 10% rule states that only 10% of energy is transferred between each trophic level. It is argued that this percentage is an inappropriate measurement. Assume that the producers in this diagram obtain 3,745 kcals of energy through the processes of photosynthesis. How much energy would the secondary consumers receive if 8.2% of energy is transferred between tropic levels? 2)Using the ideas of energy transfer through trophic levels, number of organisms, and biomass, explain why vegetarians have a smaller energy footprint than a person who eats meat.
Role of organisms in communities • Keystone species • What is a keystone in architecture? • Trophic cascade • High level predators can keep levels of secondary consumers in check, which promotes the success of the producers • Ecosystem engineers • Physical changes in the ecosystem • Ex: dams, aeration of soil • Affecting the environment • Ex: moving seeds around, filtering the water
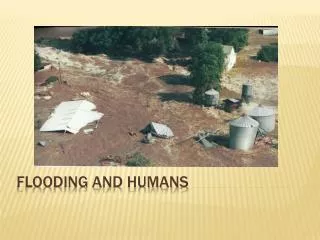
Disturbances in the ecosystem • Resistance versus resilience versus permanent change • Succession • Primary succession: think glaciers, volcanoes, anything that exposés rock and sand • Pioneer species: most commonly liches that can break down the stone and create new soil • Secondary succession: think fires, hurricanes, logging, farming, anything that removes the majority of living things • Both types of succession will lead to climax communities
How stable are communities? • Clements (communities) versus Gleason (populations) • Most people now agree with Gleason, populations can come and go from communities • Ecologists will study how conditions in different stages of succession can lead to other stages • Phase shifts/Regime shifts can sometimes occur if keystone species are lost, declining populations, or major environmental changes • Invasive species can have a major role in changing communities • May be missing limiting factors • Restoration ecology/Ecological restoration
Ecosystem Ecology in ecosystem ecology, scientists study the flow of energy and nutrients, both the living and non-living components of a system (Chapter 5), this study focuses on systems including the lithosphere (rocks), atmosphere (air), hydrosphere (water), and biosphere (living things). It also focuses on ecosystem services that we rely upon.
Environmental Systems • Systems are networks of relationships among parts that interact with and influence each other through the exchange of energy, matter and information • Feedback loops: a systems output can also create input for a system • Negative feedback loop (you want negative test results in the doctors office): output brings the system back to a starting point, and is therefore stabilized, these are stable systems and the only ones that can be sustained over a long period of time (dynamic equilibrium, homeostasis) • More prey increased the number of predators, which in turn decrease the number of prey • Positive feedback loops: drive the change to a further extreme • Melting ice decreases the amount of sunlight reflected from the planet, increasing the temperatures and melting more ice • It is hard to understand feedback without looking at the larger systems because properties emerge at different levels • If a property emerges at the ecosystem level, looking only at a single population may not allow you to see the loop
Example of interactions in a system (hydrosphere) • There is a dead zone in the Gulf of Mexico due to hypoxia, it is more easily understood if we look at entire area of land that drains into the gulf, the river’s watershed • As nutrients from farmers fertilizers and waste water treatment facilities enter the watershed, the drive the growth of phytoplankton, which in turn increases the number of consumers, when these organisms die and sink to the bottom of the water, bacteria populations grow quickly, these bacteria use cellular respiration to break down their food, consuming oxygen and creating hypoxia for fish and other organisms living in lower regions of the water • This process is called eutrophication and is considered to be a negative feedback loop
Ecosystems • Arthur Tansley was the first to recognize that living and nonliving entities interact • Energy flows in one direction, matter is cycled • Sketch an image that shows the flow of energy and the cycling of matter through trophic levels • Nutrients tend to be limiting factors in marine systems • Macronutrients are required in large amounts (nitrogen, carbon, phosphorus) • Phosphorus is more limiting in freshwater while nitrogen is more limiting in ocean waters • Micronutrients are necessary, but needed in small amounts
Primary Productivity • Energy is converted to biomass • Starting with producers, photosynthesis creates energy in the chemical bonds of sugar, this energy is the gross primary production • Energy that remains after producers complete cellular respiration is the net primary production, this is what will become biomass • The gross productivity of the producers in an ecosystem is 5,327kcals of energy. Producers in this system will use 300kcals of energy for cellular respiration. What is the net primary productivity of this system? • The overall rate at which energy is produced is productivity
Secondary Productivity • The biomass generated by consumers after eating producers is known as secondary production • In the previous system, 10% of energy is passed between trophic levels. It takes 350kcals of energy to support every 100g of biomass in primary consumers. The average consumer in the system has a mass of 400g, how many primary consumers can be supported in this ecosystem? • Human currently use approximately ¼ of the Earth’s net primary productivity, why could this lead to a problem that could topple food chains/webs?
Studying Ecosystems • Geographic Information System (GIS) is used to create a picture of the landscape being studied • Boundaries are not firm, areas where ecosystems interact are called ecotones • Landscape ecology allows scientists to study how structures in the landscape affected organisms • Patches are spread in a mosaic • Populations that stay within patches, but could move and mate within the patches are called metapopulations, • If organisms can not move between patches, extinction is a greater possibility, so this research is important to conservation biologists • Modeling is also used to represent complex relationships seens in ecosystems
Ecosystem Services(you will want to memorize and use these throughout the course, you will need to know them for the AP test!) • Forming soil, preventing soil erosion • Purifying water • Purifying air • Regulating oxygen and other atmospheric gasses • Storing water • Protect against floods • Pollinating plants we eat • Removing toxins from soil, water and air • Controlling pests • Provides habitats • Provides medications, pets, plants, genes • Breaking down waste products • Stabilize the climate • Recreation • Aesthetic enjoyment
Biogeochemical Cycles • Unlike energy, nutrients cycle through an ecosystem • Nutrients are said to move from one reservoir (pool) to another, and spend a varying amount of time in each (residence time) • The rate at which nutrients move is called flux • Reservoirs that release more than they accept are called sources, those that accept more are called a sink • Human activities have changed fluxes which may cause negative and/or positive feedback loops
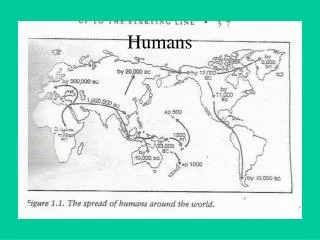
Demography/Human Populations Demography is studying the statistical changes of human populations through the application of principles of population ecology
How did we get here? • 7B+ humans (1 million x 1,000 = 1 billion) • Exponential growth: increasing in a quantity by a fixed percentage per unit of time • Global growth rate peaked in the 1960’s and has declined since then • Currently grows at 1.2% (this seems small)
Calculating Growth Rate • We can roughly estimate the doubling rate of human populations with some knowledge of how populations grow • Human growth is exponential (logrithmic) • 100 x .7 = ln 2 • Therefore, we can use 70 as a shortcut! • If you know the growth rate, you can figure out how many years it will take for the population to double • China’s population growth rate is 1.2 • 70/1.2=58.3 • ln2/1.2=.578x100=57.8
Is this a problem? • Malthus and Ehrlich • Food production has balanced rapid growth in recent decades • What would cornucopians think of this? • What would environmental scientists say? • Can we maintain quality of life for all people? • How do the views of Asian governments differ from those of European governments on this topic?
Demographic transitions Life Expectancy change due to living conditions (healthcare, sanitation, food supplies, need for labor) that can be linked to demographic transitions • Pre-industrial stage • High death and birth rates • Relatively stable population • Industrialization • Low death, high birth rates • Industrial Stage • Low death, falling birth rates • Post-Industrial Stage • Low birth and death rates • Population may be impacted by immigration
IPAT(S) Model The IPAT model offers us a way to measure the impact human population may have on the Earth. I = P x A x T x S • I= impact on environment • P= population • A= affluence • T= technology • S?= sensitivity of environment • Name one way that technology could increase the impact on the environment and one way it could decrease the impact on the environment. • According to this equation, would an arid region of southeastern China where plants grow slowly be more or less impacted by increasing affluence than a moist region where crops are plentiful?
Studying Human Populations • Demography: can be used to predict what will happen to populations and potential environmental impacts of populations • Population Size • Doesn’t really tell us the entire story, need other factors • Density/distribution of population • Human populations tend to be clumped (draw a quick sketch of this), this means environmental impacts will be greater in some areas than others • Age structure of population • Sex Ratio of population • Rates of birth, death, immigration, emigration
Interpreting age structure diagrams • Draw a sketch of an increasing, stable, and decreasing population (assume that the ratio of males to females is around 50:50) • Interpret the following graphs:
Growth versus total population • What does this graph show us?
Demographics are linked to society • Fertility Rates • Total fertility rate: number of children an average woman has in her lifetime, should not fall below 2.1 • Replacement fertility: each couple only having 2 children (2.1 actually) • Natural rate of population change (only birth versus death rates) is becoming a problem in Europe • Empowering woman • Fertility rates drop when woman have access to birth control • Population policies • Most countries do not have a firm policy at this point, but encourage reproductive rates at or below 2.1 • Poverty • 99% of the next billion people will be born in developing nations • More than 82% of people live in developing nations
Demographics are linked to society • Consumption/Affluence • Humans are living with a 30% overshoot in our ecological footprint • 1 American = 4.5 Chinese = 10 Indians = 19 Afgans • Wealth Gap • HIV/AIDS • Some regions still have increasing death rates • Economic repercussions • Demographic fatigue: overwhelming challenges faced by countries including • Losing young and productive members of society to disease • Educating/finding jobs for young people • Population Goals/Sustainable Development • United Nations Millennium Declaration: sets forth 8 goals for society • http://www.un.org/millenniumgoals/