Download
1 / 7
70 likes | 192 Views
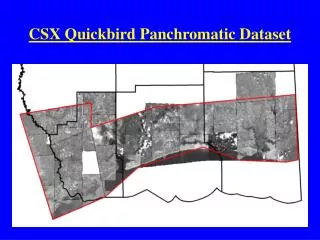
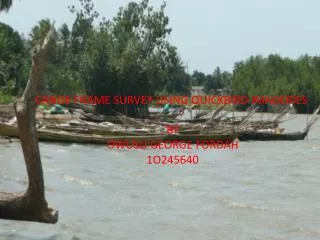
This study presents an innovative methodology for conducting canoe frame surveys using QuickBird satellite imagery to enhance the efficiency of fishing activity control along Ghana's coastline. Traditional methods are time-consuming and expensive, often requiring months for accurate counts. By utilizing satellite images covering approximately 20,000 km² of central Ghana's fishing area, the research highlights an automated approach using image segmentation and thresholding methods. The findings are intended to promote sustainable exploitation of marine resources while reducing operational costs.

E N D
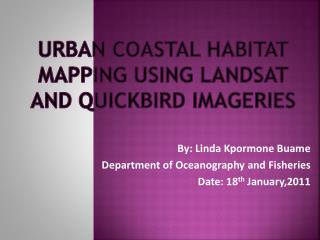
CANOE FRAME SURVEY USING QUICKBIRD IMAGERIES CANOE FRAME SURVEY USING QUICKBIRD IMAGERIES BY OWUSU GEORGE FORDAH 1O245640 BY OWUSU GEORGE FORDAH 10245640
INTRODUCTION • Over the past years carrying out an effective control of fishing activities has become essential to guarantee a sustainable exploitation of sea resources.(ie estimating fishing effort) • Traditional reconnaissance can be time consuming and expensive (e.g MFRD spends 1-2 months to counts canoes along the 550km stretch Ghana’s coastline) • Satellite-based imageries provides a powerful surveillance capability which can be utilized in canoe frame surveys Canoes scattered along the beach area
METHODOLOGY • The imagery covers part of central region. • The area itself, is one of the largest fishing area and covering an area of approximately 20,000 km2 is economically important in terms of fisheries An adjusted Quickbird image ( data used)
APPROACH Shape measurement analysis Threshold Conversion of Image in Binary Canoe detection Preprocessing Gray Image [isolating of beach area] Original Quickbird Image Obtaining Result Flowchart of the developed routine
THRESHOLDING • Thresholding is the simplest method of image segmentation. From a grayscale image, it can be used to create binary images (Shapiro, et al. 2001:83). • Images in grayscale have digital numder (DN) • The histogram method used shows the pixel distribution through which the threshold could be obtained. Histogram showing pixel distribution
GRAYSCALE TO BINARY IMAGE Canoe The binary image 1:100,1:100 window of the gray image
REFERENCE • Amador, K., Bannerman, P., Quartey, R. and Ashong, R. 2006. Ghana Canoe Frame Survey. Information Report Number 34. Marine Fisheries Research Division. Ministry of Fisheries. Ghana. • Anon (2001) Report on the (2001) Ghana Canoe Framework Survey, Marine Fisheries Research Division Tema Ghana • Anon (2000). Ghana Living Standard Survey Report of the Fourth Round. Accra Ghana. Statistical Service Publication Accra Ghana. • Anon (1998) Report on the 1997 Ghana Canoe Framework Survey, Marine Fisheries Research Division Tema Ghana • FAO. 2007. Ghana Fishery Country Profile (available at: wwiaw.fao.org/fi/website/FISearch.do?dom=country) • Koranteng, K A (1980) Trawl, Survey of Demersal Fish Stock 1990/81 Program Of Fisheries Research And Utilization Branch (FKRUB) Tema, Ghana. • Koranteng, K A (1984) A Trawling Survey Of Ghana, Cacaf/Tech,84/03 Dakar, Senegal: CECAF Project (FAO). • Satia, B. P. (1993) Ten Years Of Integrated Development of Artisanal Fisheries in W/A. Integrated Development Of Artisanal Fisheries Technical Report No 50, Cononou, Benin . IDAF Program (FAO)