Download
1 / 28
280 likes | 406 Views
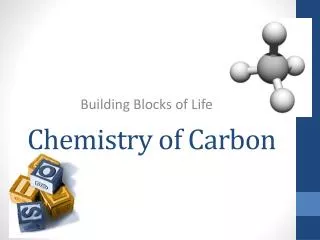
Discover the intricate web of carbon chemistry that powers life on Earth, from atmospheric CO2 to organic carbon burial. Dive into the natural carbon cycle and the significant role of photosynthesis and respiration. Explore the history of oil production, including Hubbert's Peak, and the potential future challenges with methane hydrates. Delve into energy consumption trends and the impact of carbon emissions. Learn about climate effects resulting from long CO2 lifetimes through trigger-minima events. Finally, imagine a sustainable solution with a Lunar Solar Power System for carbon sequestration.

E N D
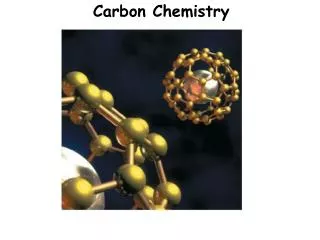
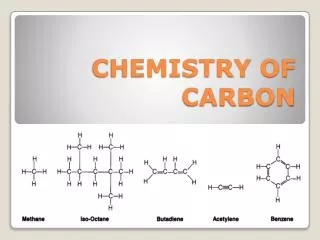
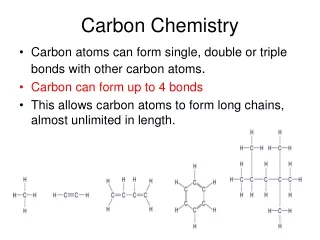
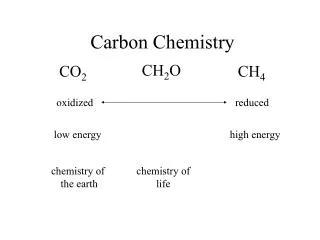
Carbon Chemistry CH2O CO2 CH4 oxidized reduced low energy high energy chemistry of the earth chemistry of life
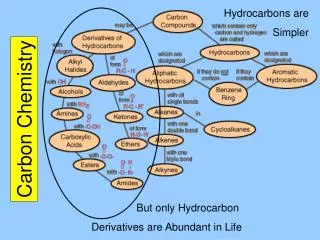
atmospheric O2 photosynthesis CO2 + H2O CH2O + O2 respiration organiccarbonburial
Organic carbon on Earth Kerogen Minable coal Oil Gas Clathrates 1,200,000 5,000 200 300 5,000 Gton C
400 Mauna Loa, Hawaii 390 380 m p p 370 , 2 O 360 C p c 350 i r e h 340 p s o 330 m t A 320 310 300 400 Barrow, Alaska 390 m 380 p p , 370 2 O C 360 p c i 350 r e h 340 p s o m 330 t A 320 310 300 1955 1965 1975 1985 1995 2005 Year
300 ) m p p ( 250 2 O C 200 M 0.8 e t 0.7 h a 0.6 n e 0.5 ( p p 0.4 m 0.3 ) 2 0 -2 C , T -4 D -6 -8 -10 400 300 200 100 0 Age ( kyr BP )
U.S. Oil Hubbert U.S. Oil Production 4 0.4 r a e 3 y r G e 0.3 t p o s n l e C r 2 r p a 0.2 e B r n y o e i a l l 1 i r 0.1 B 0 0 1900 1950 2000 2050
World Oil Hubbert World Oil Production 50 45 500 Gton C 40 eventual r a 35 e y r 30 e 117 Gton C p s already l 25 e extracted r r Hubbert Peaks a b 20 n o i l 15 l i B 10 200 Gton C eventual 5 0 1900 1950 2000 2050 2100 Year
Clathrate Sensitivity to Temperature 30000 C n o t G Future? Today , 25000 y r o t n e v 20000 n I e n a h t 15000 e M e t a t 10000 S y d a e t Coal 5000 S LGM Oil/Gas 0 -4 -2 0 2 4 6 Ocean Temperature, Offset from Present Day
16 14 Energy Consumption 12 s t 10 t a W 8 a r 6 e t 4 2 0 12 Energy Consumption 10 Per Person s t 8 t a W 6 o l i k 4 2 0 1400 Energy Consumption 1200 per Dollar GDP s 1000 t t a 800 W 600 400 200 0 l l . k e n a a i a i S r z c a n b d . a a i n p o U h n r m a a I l B C r J G n F e D
Carbon Emission per Energy Yield 0.9 0.8 t 0.7 t a W 0.6 a r e t 0.5 r e p 0.4 C n o 0.3 t G 0.2 0.1 0 Gas Oil Coal
8 ) n 7 o t Carbon release in CO per year 2 G 6 ( s 5 n o t 4 c i r t 3 e m 2 n o 1 i l l i B 0 6 5 Carbon released per person s 4 n o t c 3 i r t e 2 m 1 0 0.8 0.7 Carbon per dollar GDP 0.6 s 0.5 m a 0.4 r g o 0.3 l i k 0.2 0.1 0 l l . k e n a a i a i S r z c a n b d . a a i n p o U h n r m a a I l B C r J G n F e D
540 520 500 480 460 440 420 400 1.4 1.2 1 0.8 0.6 0.4 0.2 0 0 100 200 300 400 500 600 700 2 m / W , n o i t a l o i s 0 n I Trigger-minima Red = Trigger-minima events e m u l o V e c I 800 Kyr Before Present
470 2 460 m / W 450 , 0 i n 440 o i t a l o 430 s n I l 420 a c i t i r 410 C 400 100 200 300 400 500 600 pCO 2
1200 a 1000 800 m t a m 600 5000 Gton C , 2 O 400 1000 C p 300 Gton C 200 3 0 I n 2 s o 1 l a t i 0 o n -1 , s -2 i 0 -3 c Interglacial Periods 6 d C ° 4 , t e s 2 f f O 0 T -2 l a b -4 o l G -6 -8 -500 -400 - -200 -100 0 100 200 300 400 500 300 Past Time, kyr Future b
SOLUTION: LUNAR SOLAR POWER SYSTEM • SUN SENDS 13,000 TWs OF RELIABLE SOLAR POWER TO LUNAR SURFACE • BASES ON MOON CONVERT SOLAR POWER TO MICROWAVE BEAMS • BEAMS DELIVER POWER TO RECTENNAS • Safe (<20% of sunlight) • Reliable (through clouds, rain, smoke, etc.) • RECTENNAS ON EARTH • Convert beams to electricity • Deliver electricity to power grid