Download
1 / 1
10 likes | 113 Views
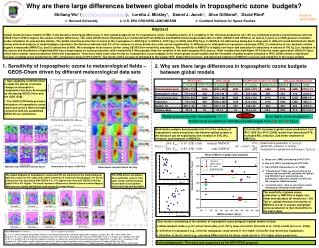
1. Sensitivity of tropospheric ozone to meteorological fields – GEOS-Chem driven by different meteorological data sets. 2. Why are there large differences in tropospheric ozone budgets between global models. ACCENT [Stevenson et al. 2005]. IPCC [2001]. IPCC [2005].

E N D
1. Sensitivity of tropospheric ozone to meteorological fields – GEOS-Chem driven by different meteorological data sets 2. Why are there large differences in tropospheric ozone budgets between global models ACCENT [Stevenson et al. 2005] IPCC [2001] IPCC [2005] This work (GEOS-Chem) • New capability of GEOS-Chem to study the effects of climate change on atmospheric composition has been developed by interfacing GEOS-Chem and the GISS GCM. • The GISS GCM fields provide a simulation of tropospheric ozone and its precursors that is broadly consistent with the established GEOS-driven simulations. GEOS-Chem 11 models 12 models GEOS-Chem 25 models GEOS-Chem GEOS-3 GEOS-4 GISS Pressure (hPa) Pressure (hPa) Photochemical prod 3420±770 4100 4620±600 4900 5060±570 4490 4249 4698 4472±14 Stratospheric influx 770±400 400 510±90 470 520±200 296 544 516 510±2 Photochemical loss 3470±520 3680 4200±480 4300 4560±720 3770 3709 4126 3990±9 Deposition 770±180 820 1000±220 1070 1010±220 1016 1084 1088 992±7 Pressure (hPa) Burden, Tg 300 ± 30 310 330 ± 30 320 340±40 294 300 304 315±3 Lifetime, days 24±2 25 24±4 22 22.4±2.0 22.4 22.9 21.3 23.1±0.4 Vertical ozone profiles for July(ppbv) Why? Global ozone production increased by 35% ! Even higher ozone production! Global ozone production in individual models ranges from 2300 to 5300 Tg/yr! 2/3 of the 35% increase in global ozone production from IPCC [2001] to IPCC [2005] results from decreased STE, increased NOx emission, and better treatment of NMVOCs. Multivariate analysis demonstrates that 2/3 of the variance of tropospheric ozone production rate between global models in the literature can be explained by the variation of STE, NOx emission, and treatment of NMVOCs. P(Ox)- global ozone production in Tg O3/yr; ENOx - global NOx emission in Tg N/yr; STE - stratosphere-troposphere exchange in Tg O3/yr. b Monthly mean afternoon surface ozone Annual cycle of ozone at 800 hPa a Zonal mean concentrations for July • Wang et al. [1998] contributing to IPCC 2001. • Bey et al. [2001] contributing to IPCC 2005. • Up to 250mb; Hauglustaine et al. [1998]. • “Standardized” P(Ox): we assume that all the models had the same NOx emission (44 Tg/N/yr) and STE (500 Tg/yr) and eliminate the perturbation caused by variations of STE and NOx using the statistical model. • “predicted value”: what we will project simply following the statistical model above. The global budgets of tropospheric ozone and OH are sensitive to the meteorological data sets used; for the same year (2001) and with all emissions being equal, the ozone production rate calculated with GEOS-4 is 11% higher than that with GEOS-3 and the global OH is 9% higher. The most important differences between these meteorological data sets are clouds distribution and convective mass fluxes. The GISS-driven simulation over-estimates ozone in the polar areas, mainly because of excessive stratospheric influx and high mixing depth. c Pressure (hPa) Pressure (hPa) Pressure (hPa) Pressure (hPa) Pressure (hPa) Pressure (hPa) Pressure (hPa) Pressure (hPa) Pressure (hPa) Select References (contact wu18@fas.harvard.edu for a complete reference) Bey, I., et al., Global modeling of tropospheric chemistry with ssimilated meteorology: Model description and evaluation, J. Geophys. Res., 106, 23,073– 23,095, 2001. Horowitz, L. W., et al., A global simulation of tropospheric ozone and related tracers: Description and evaluation of MOZART, version 2, J. Geophys. Res., 108(D24), 4784, 2003. Liu, H., et al., Radiative effect of clouds on tropospheric chemistry in a global three-dimensional chemical transport model, submitted to J. Geophys. Res. - Atmospheres, 2005. Stevenson, et al., Multi-model ensemble simulations of present-day and near-future tropospheric ozone, submitted to Journal of Geophysical Research, 2005. Wang, Y., D. J. Jacob, and J. A. Logan, Global simulation of tropospheric O3-NOx-hydrocarbon chemistry: 1. Model formulation, J. Geophys. Res., 103, 10,713– 10,725, 1998. Why are there large differences between global models in tropospheric ozone budgets? Shiliang Wu1 (wu18@fas.harvard.edu), Loretta J. Mickley1, Daniel J. Jacob1, Alice Gilliland2, David Rind3 1. Harvard University 2. U.S. EPA ORD/NERL/AMD/MEARB 3. Goddard Institute for Space Studies Paper # A51B-0044 Abstract Global chemical tracer models (CTMs) in the literature show large differences in their global budget terms for tropospheric ozone, including a factor of 2 variability in the chemical production rate. We use statistical analyses and simulations with the GEOS-Chem CTM to explore the causes of these differences. The same GEOS-Chem simulations are conducted with two different assimilated meteorological data sets for 2001 (GEOS-3 and GEOS-4), as well as 3 years of a GISS general circulation model simulation for present-day climate. The global chemical production of ozone in the troposphere is 4250 Tg/yr in GEOS-3, 4470 Tg/yr in GISS, and 4700 Tg/yr in GEOS-4, the differences being due in large part to different cloud distributions. Multi-variate statistical analysis of model budgets reported in the literature indicates that 2/3 of the variance in ozone production rates can be explained by (1) differences in stratosphere-troposphere exchange (STE), (2) emissions of non-methane volatile organic compounds (NMVOCs), and (3) emissions of NOx. We investigate these factors further using GEOS-Chem sensitivity simulations. The sensitivity to NMVOCs is highly non-linear and saturates for emissions in excess of 100 Tg C/yr. Variation in the source and distribution of lightning NOx has a large impact on ozone production, with a sensitivity 5 times greater than the variation in the anthropogenic NOx source. Older models often had higher STE than the newer generation (500±100 Tg/yr), which led to weaker ozone production within the troposphere. There have been some clear trends for tropospheric ozone budgets in the recent global model studies and the ensemble of global models compiled in IPCC [2005] shows a significant increase of global ozone production by 35% compared to those in IPCC [2001]. Two thirds of this increase is attributed to the weaker STE, higher NOx inventory, and improved treatment of NMVOCs sources and chemistry in the newer models. The sensitivity of global ozone production to NMVOCs is highly non-linear and saturates for emissions > 200 TgC/yr; global emission inventories of NMVOCs are far in excess, and global ozone production is then insensitive to the exact value. Other factors contributing to the variation of tropospheric ozone budgets in global models include: a. Meteorological fields (e.g. UV actinic fluxes [Bey et al. 2001], deep convection [Horowitz et al., 2003], clouds [Liu et al., 2005]). b. Definition of tropopause (e.g., chemical tropopause could results in 10% higher O3 burden than dynamical tropopause). c. Definition of the Ox family (e.g., excluding PANs from the Ox family could results in 10% higher ozone production). Acknowledgments: This work was supported by the EPA-STAR program.