Download
1 / 34
340 likes | 431 Views
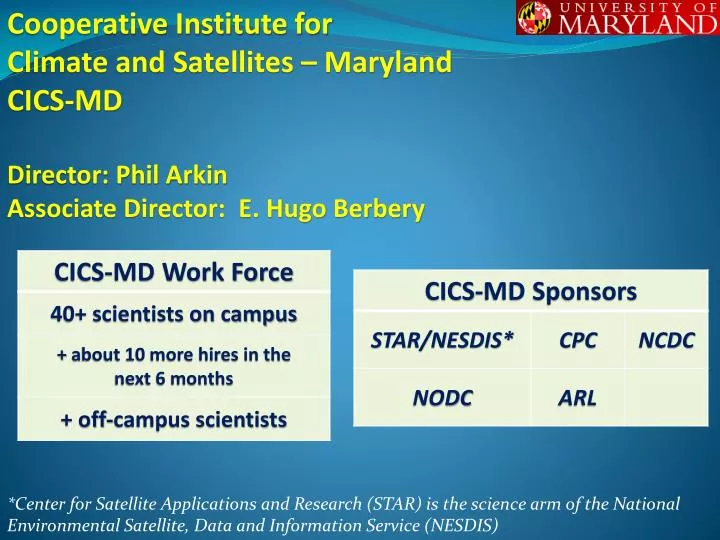
Cooperative Institute for Climate and Satellites – Maryland CICS-MD Director: Phil Arkin Associate Director: E. Hugo Berbery. *Center for Satellite Applications and Research (STAR) is the science arm of the National Environmental Satellite, Data and Information Service (NESDIS).

E N D
Cooperative Institute for Climate and Satellites – MarylandCICS-MD Director: Phil Arkin Associate Director: E. Hugo Berbery *Center for Satellite Applications and Research (STAR) is the science arm of the National Environmental Satellite, Data and Information Service (NESDIS)
Cooperative Institute for Climate and Satellites CICS VISION CICS performs collaborative research aimed at enhancingNOAA's ability to use satellite observations and Earth System models to advance the national climate mission, including monitoring, understanding, predicting and communicating information on climate variability and change.
CICS MISSION CICS conducts research, education and outreach programs in collaboration with NOAA to: 1. Develop innovative applications of satellite observations and advance transfer of such applications to enhance NOAA operational activities; 2. Investigate satellite observations and design information products and applications to detect, monitor and understand the impact of climate variability and change on coastal and oceanic ecosystems; 3. Identify and satisfy the satellite climate needs of users of NOAA climate information products, including atmospheric and oceanic reanalysis efforts;
CICS MISSION (cont.) 4. Improve climate forecasts on scales from regional to global through the use of satellite derived information products, particularly through participation in the NOAA/NWS/NCEP Climate Test Bed; 5. Develop and advance regional ecosystem models, particularly aimed at the Mid-Atlantic region, to predict the impact of climate variability and change on such ecosystems; and 6. Establish and deliver effective and innovative strategies for articulating, communicating and evaluating research results and reliable climate change information to targeted public audiences.
Themes Theme 1: Climate and Satellite Research and Applications. - Development of new observing systems, or new climate observables from current systems. Theme 2: Climate and Satellite Observations and Monitoring. - Development and improvement of climate observables from current systems. - Development of all continental and global fields of climate parameters that can be used for climate analysis and climate model initialization. Theme 3: Climate Research and Modeling. - Bring together climate observables, modeling and validation in a comprehensive integrated whole. - Bring together observational products with model development efforts to enable research into the improvement of forecasts of climate system variability on space scales ranging from regional to global, and time scales from a week or two to centuries.
Theme 1: Climate and Satellite Research and Applications Development of new observing systems, or new climate observables from current systems.
A Climate Data Record (CDR) is “a time series of measurements of sufficient length, consistency, and continuity to determine climate variability and change.” (Wikipedia, of course) • Objectives • Develop Fundamental Climate Data Record for Advanced Microwave Sounding Unit-B (AMSU-B) and Microwave Humidity Sounder (MHS) window channels. • Develop AMSU-A FCDR’s for window channels • Assess the current state of land surface emissivity models/retrieval • Inter compare models to study their differences and similarities Characterizing scan bias in AMSU-B/MHS ChabithaDevaraj, HuanMeng, Ralph Ferraro Development of AMSU-A Fundamental CDRs Wenze Yang, HuanMeng, Ralph Ferraro • An Evaluation of Microwave Land Surface Emissivities for use in Precipitation Algorithms • Cecilia Hernandez, Ralph Ferraro
Geolocation and Navigation Correction for Microwave Satellite Data Isaac Moradi • Goals • Investigate and correct different sources of the geolocation and navigation errors, including • satellite attitude • sensor mounting • timing • geolocation algorithm Geolocation error in NOAA level-1b data which is visible along the coastlines. Left: before correction. Right: after correction • Some findings • NOAA-15 AMSU-A 2 is mounted about one degree negative along track • NOAA-17 level-1b data are not corrected for timing error at all • MHS step angle was wrong in the first year of operation (1.1 instead of 10/9) The difference between data from ascending and descending orbits is used to characterize the geolocation errors. Left: a difference map before correction, Right: after correction
A Fundamental Climate Data Record for the AVHRR Jonathan Mittaz Objective To recalibrate the historic AVHRR Level1B IR radiances to be as accurate and stable as possible • Results • Historic AVHRR’s show strong scene and instrument temperature dependent biases • New calibration removes both types of bias and indicate that the AVHRR can be accurate to ~ 0.05K and stable to < 0.1K/decade. • Has significant impact on Sea Surface Temperature retrievals Top LH panel shows errors caused by operational calibration. Top RH panel shows improvement with new calibration (MetOp-A). Left panel shows errors in SST retrievals due to operational calibration for NOAA-16 overlaid with the bias that can be removed by new calibration (black line).
TRMM TMI V7l Over Land Rainfall Algorithm & Developing Winter Precipitation Algorithm over Land from Satellite Microwave and Field Campaign Observations Nai-Yu Wang, Kaushik Gopalan, Ralph Ferraro Objectives Recent improvements were made to the TRMM Microwave Imager (TMI) Version 7 land rainfall algorithm global based on empirical analysis of a mutiyear global set of collocations between TMI and the precipitation radar measurements. Objectives The goal is to develop a snowfall algorithm using high frequency microwave radiometer observations in conjunction with hydrometeor profiles from radar, aircraft and ground measurements.
Improving Geosynchronous Satellite Rainfall Estimates Using Lightning Information WeixinXu, Robert Adler, and Nai-Yu Wang Objectives NOAA’s GOES-R satellite (to be launched in 2016) will have first ever Geosynchronous Lightning Mapper (GLM). This study is using TRMM data to develop the basis and eventually the algorithms to combine GOES-R Infrared (IR), GLM data and microwave calibrator to provide an improved geosynchronous rainfall product for use in identifying heavy rain events and improve flood warnings. Red: storms with lightning Blue: storms without lightning Results Lightning occurrence has been shown to identify convective cores, especially stronger cores (higher reflectivities as indicated by TRMM radar) andarea of lightning flashes is strongly related to convective rain area (TRMM radar echoes > 45 dBz). These relations will be used in development of GOES-R rain algorithm.
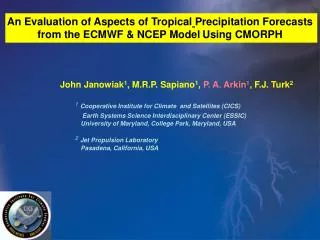
Validation of NESDIS-STAR Precipitation Products John Janowiak Objectives Provide STAR scientists with information to improve their products • Results • Best performers are algorithms that use multiple satellites & sensors • Satellite algos. perform better than model fore-casts during warm season
Participation in the CHUVA Field Campaign Rachel Albrecht and Scott Rudlosky • Objectives: • Investigate relationships between lightning, polarimetric radar, and satellite (GOES-R proxy) information • Deploy a Lightning Mapping Array (LMA) in Sao Paulo, Brazil • Compare LMA information with a wide variety of Lightning Detection Systems • Results: • LMA deployed during October 2011 • CHUVA IOP – 1 November 2011 through 1 March 2012 • http://branch.nsstc.nasa.gov/splma/ • http://chuvaproject.cptec.inpe.br/portal/en/ LMA Sensor Locations LMA Computer LMA Sensor
Development and Validation of Satellite Active Fire Detection and Characterization Algorithms Dr. Wilfrid Schroeder, CICS/UMD • Objectives • Develop, validate, and refine satellite active fire detection and characterization products • Explore multi-resolution data sets (ground, airborne, and spaceborne) to map biomass burning across different spatial and temporal scales Coincident 1km Terra/MODIS and 30m ASTER Fires • Results • Comprehensive validation and refinement of MODIS active fire product • Development of new active fire products (e.g., Landsat) • Development of stable long-term continental/global fire data records (e.g., GOES) Global validation of Terra/MODIS fire product High temporal and spatial resolution airborne fire science data
Improving GOES-R Cloud and Precipitation Products Associated with Deep Convective Systems by using NEXRAD Radar Network over the Continental U.S Zhanqing Li (UMD) & Xiquan Dong (UND) AMSR-E rainrate CPR rainrate MODIS COT • Objectives • Evaluate current GOES-retrieved precipitation (SCaMPR) • Develop & evaluate satellite-based cloud classification & precpitation • Results • New algorithm developed for estimating precipitation from warm clouds; • NEXRAD demonstrates great potential for differenating precipitating and non precipitating from deep cloud anvil. We (Chen et al. 2011, GRL) demonstrated the potential of using MODIS-derived cloud microphysics information to retrieve rainrate for warm precipitation, which are almost all missed by microwave-based AMSR-E rainfall algorithm.
Theme 2: Climate and Satellite Observations and Monitoring Development and improvement of climate observables from current systems. Development of all continental and global fields of climate parameters that can be used for climate analysis and climate model initialization.
Monitoring Phytoplankton Variability From Space Christopher Brown • Objectives • Monitor & document variability in marine algae and their productivity: • Distribution • Seasonality • Phenology (= timing) • Results • Documenting: • Global phenology • Seasonality • Distribution of blooms of the coccolithophoreEmilianiahuxleyi Average date of phytoplankton bloom onset for the period 1998 – 2009 as derived from SeaWiFS data.
Statistical Reconstruction and Analysis of Ocean Chlorophyll Concentrations Stephanie SchollaertUz Objectives Reconstruct ocean color chlorophyll concentrations back 50 years to test the hypothesis that climate-scale oscillations are reflected in spatial patterns of phytoplankton blooms. • Results • SeaWiFS chlorophyll are gap-filled using MODIS Aqua to give 13 continuous years. • Canonical Correlation Analysis with physical proxy data (e.g. sea-surface temperatures) is used to reconstruct chlorophyll. Figure: Combined chlorophyll (SeaWiFS and MODIS Aqua) anomalies used to train the canonical correlation analysis algorithm. The first 4 modes capture 44% of the variability over 52 seasons (9/1997-8/2010)
The Performance of Hydrological Monthly Products using SSM/I – SSMI/S sensors Daniel Vila, Cecilia Hernandez, Ralph Ferraro, HilaweSemunegus • Objectives • Improve the quality control (QC) of historical antenna temperature of SSM/I sensor • Develop an improved strategy to extend the SSM/I time series into the SSMI/S era • Results • The mean bias between the original and the reprocessed dataset is around 3 mm mon-1 for precipitation. That amount could be significant in long trend analysis • Histogram matching technique appears as a suitable approach to extend the current dataset into SSMI/S era Rainfall annual running mean (in mm mon-1) for the period 1992-2007 over land for three different estimates: SSMI current (reprocessed and QC checked database), GPCC and the original database. Global Rainfall Distribution for October 2010 using SSMI/S F17
Snow Depth on Arctic Sea Ice Sinead L. Farrell 1, 2 and Nathan T. Kurtz 1, 3 1 CICS/ESSIC/UMD 2 NASA GSFC 3GESTAR/Morgan State Uni. • GOALS: • Derive pan-Arctic snow depth on sea ice using new, Uni. Kansas airborne snow radar system • Validate airborne data using in situ measurements • RESULTS: • NASA Operation IceBridge (OIB) snow depth measurements were validated using coincident in situ data on fast ice at the Danish “GreenArc” ice camp in 2009 • Agreement between in situ and airborne snow depths over level sea ice to better than 3 cm • IceBridge Arctic 2009 data used to produce trans-Arctic snow depth (Fig. 1) • Snow depth on multiyear ice is consistent with historical climatological values • Snow depth on first year ice is ~50% of the climatological value Arctic Ocean Greenland Fig. 1 IceBridge Snow Depth along 2009 aircraft flight-lines, overlaid on snow depth climatology from Warren et al., 1999 Farrell, S. L., N. Kurtz, et al. (2011),A First Assessment of IceBridge Snow and Ice Thickness Data over Arctic Sea Ice, IEEE Transactions on Geoscience & Remote Sensing, 50 (6), doi:10.1109/TGRS.2011.2170843, in press. Kurtz, N. T. and S. L. Farrell (2011),Large-scale surveys of snow depth on Arctic sea ice from Operation IceBridge, Geophys. Res. Lett., 38, L20505, doi:10.1029/2011GL049216.http://www.agu.org/pubs/crossref/2011/2011GL049216.shtml
LongwaveRadiative FluxesR. T. Pinker • Important component of energy budget • Methodology: • Artificial Neural Networks • Trained with simulations from Rapid • Radiative Transfer Model (RRTM) and • clouds from CloudSat and Calipso • Implemented with: • Moderate Resolution Imaging • Spectroradiometer (MODIS) data, • ISCCP DX and inputs from the • European Centre for Medium-Range • Weather Forecasts (ECMWF) ERA- • Interim model. • Evaluated against: • WCRP BSRN observations • PIRATA, TOA and buoys of opportunity • Work in support of MEaSURES Activity • (with Grad student E. Nussbaumer)
Dr. CezarKongoli’s Research • Development of a 4-km snow depth product for the Northern Hemisphere • Optimal analysis approach of blending satellite and in-situ snow depth data within the Interactive Multi-Sensor Snow and Ice (IMS) Mapping product- Principal Investigator; NOAA/PSDI funding • Development of a two-source snow-vegetation energy balance model • Use of diagostic surface radiative temperature (retrieved from remote sensing) for the instantaneous estimation of surface fluxes and melt rates- Principal Investigator; USDA funding • Evaluation and improvement of NOAA’s AMSU snowfall rate and detection algorithms • Improvement of the performances of the snowfall detection and rate algorithms based on AMSU data - Principal Investigator; NOAA/NESDIS/STAR funding • Development and evaluation of the GOES-R snow depth product • Based on the snow-fraction – snow depth relationship over sparse vegetated land areas for the future GOES-R sensor– Co-Investigator; NOAA GOES-R funding
Theme 3: Climate Research and Modeling Bring together climate observables, modeling and validation in a comprehensive integrated whole. Bring together observational products with model development efforts to enable research into the improvement of forecasts of climate system variability on space scales ranging from regional to global, and time scales from a week or two to centuries.
Climate Analyses Thomas M Smith First joint empirical orthogonal function of historical reconstructions of oceanic cloudiness, precipitation, and sea-surface temperature.The annual cycle is removed and data are normalized before the JEOF is performed. This JEOF gives the dominant joint variations in these reconstructed climate fields. Objectives 1) Improve satellite analyses 2) Use satellite analyses to help analyze historical data 3) Improved NOAA-University interactions • Results • Development of historical ocean-area precipitation analysis • Development and improvement of other historical analyses • Providing guidance to students and young researchers
Seasonal Drought Prediction over the United StatesLi-Chuan Chen and Kingtse Mo • Objective: • To predict meteorological drought over the contiguous United States using standardized precipitation index (SPI) based on precipitation forecasts from NCEP Climate Forecast System version 2. • Results: • Six-month SPI (SPI6) is skillful out to 3-4 months. • Skill is seasonally and regionally dependent. • Seasonal forecasts became operational in April 2011. Products are available at http://www.cpc.ncep.noaa.gov/products/Drought/Figures/index/spi.fcst.gif IC: 15-16 October 2011
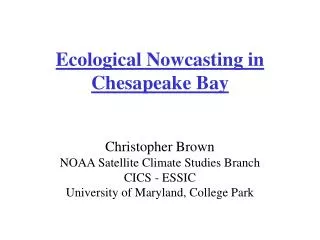
Ecological Forecasting in Chesapeake Bay Christopher Brown Objective Generate short-term, ecological forecasts of Chesapeake Bay Ecological Forecast Example: Likelihood of encountering sea nettles, Chrysaoraquinquecirrha, in Chesapeake Bay on August 17, 2007. • Results • Daily generate & disseminate forecasts of several noxious organisms: • Sea nettles (jellyfish) • Harmful algal blooms • Water-borne pathogens
Evaluation of Simulations of 20th Century Precipitation Li Ren Simulations of precipitation from one C20C , 11 CMIP5 historical simulations and 24 AR4 model runs are compared to 6 Reanalysis products (ERA-Interim, NCEP1, MERRA, CFSR, JRA25, 20thC) and GPCP and CMAP observations. Aspects to be evaluated include: Long-term mean seasonal cycle over large domains (global, hemispheric, land/ocean, continental); The simulation of precipitation features associated with El Niño/Southern Oscillation (ENSO), NAO and PDO. • Global mean annual mean: the observations (mean of GPCP and CMAP) are lower than the reanalyses (mean of 6 reanalyses) and the simulations; CMIP5 are closer to the reanalyses; C20C is the highest (Figure). • Mean seasonal cycle: not much seasonal cycle on a global average; the N. and S. hemisphere out of phase; the simulations differ more from the observations in the ocean, particularly C20C; in the tropics GPCP is the lowest over the ocean (not shown). Red lines mark the medians; the bottom of the box marks the 25th percentile ; the top of the box marks the 75th percentile; lines extending from the top of the boxes mark the 98th percentile and from the bottom of the boxes mark the 2th percentile; the red plus signs mark the outliers (outside of the 98th percentile and 2th percentile).
Terrestrial Ecosystem Functional Types Omar Müller, Domingo Alcaraz-Segura, Hugo Berbery Objectives To develop measures of ecosystems from remote sensing information, Assess their vulnerability and resilience to climate variations and extremes, and Incorporate EFTs in models to investigate ecosystem-atmosphere feedbacks and coupling. Ecosystem Functional Types based on three descriptors of the seasonal dynamics of the NDVI estimated from MODIS images for the period 2001-2009. Results Use of EFTs allows for time varying land surface states (usually fixed with traditional land cover types) Use of EFTs improves the simulation of the drought and reduces the biases in regions of high P.
As scientists, we are confronted with the challenge –and pressure- of developing new products while ensuring they are of the quality and reliability needed to give truthful information.
Regional climate modeling: Should one aim to improve also on the large scales? Can one do better than using the relaxation lateral boundary conditions? Fedor Mesinger Objectives: • Test: in verifications against analyses, is it possible to improve on large scales, compared to driver model, with no large scale nudging? • Test: could more mathematically correct lateral boundary conditions (LBCs) do better than customary relaxation LBCs? Experiment design: Domain size: 12,000 x 7,550 km; Verifications: placing of strongest 250 hPa winds (as in precipitation verifications), and RMS wind difference forecast-ECMWF analyses (shown in the two plots to the right) 26 forecasts 6 forecasts Results: Verifying 26, and 6, Eta RCM 32-day forecasts against driver ECMWF ensemble forecasts, in two ways, gave answers to both test questions above: Yes, more often than not so Red: ECMWF driver members Blue: Eta RCM, Eta LBCs Green: Eta RCM, relaxation Reference: Veljovic et al., 2010, Met. Zeitschrift, 19, 237-246.