Download
1 / 18
250 likes | 733 Views
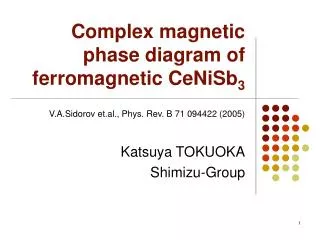
Complex magnetic phase diagram of ferromagnetic CeNiSb 3. V.A.Sidorov et.al., Phys. Rev. B 71 094422 (2005) Katsuya TOKUOKA Shimizu-Group. Contents. Introduction about… Ce Compounds, magnetic order , QCP,… etc. Experimental results and discussion Summary. 4f – electron in Ce compounds.

E N D
Complex magnetic phase diagram of ferromagnetic CeNiSb3 V.A.Sidorov et.al., Phys. Rev. B 71 094422 (2005) Katsuya TOKUOKA Shimizu-Group
Contents • Introduction about… Ce Compounds, magnetic order , QCP,… etc. • Experimental resultsand discussion • Summary
4f – electron in Ce compounds Lanthanides La3+ Ce3+ Pr3+ … 4f-electrons 0 1 2 Closed shell 5s25p6 4f - electron is localized. |r R(r)|2 Direct spin interaction between 4f-electrons is hard to occur. r (a.u.) http://www.phy.saitama-u.ac.jp/~saso/saso.html
RKKY interaction(Ruderman-Kitel-Kasuya-Yoshida) Conduction electrons Exchange interaction Long-range order appeared ! 4f - electrons Indirect f-f interaction is mediated by conduction electrons.
Kondo effect Conduction electrons Spin singlet S=0 4f - electrons Magnetic moment is screened by hybridization between conduction electrons and f electrons. f-electrons are itinerant . Heavy fermion state ! (重い電子状態)
Pressure effect RKKY interaction Kondo effect Delicate balance Heavy Fermi liquid behavior Magnetic ordering TRKKY ∝ Jcf2 TK ∝ exp(-1/Jcf) P RKKY interaction is dominant ( f-localized ) 局在 Kondo effect is dominant ( f-itinerant ) 遍歴 Tune by pressure
Motivation CeNiSb3 Ferromagnetic ground state Tc = 6 K Applying pressure… How does ferromagnetism change ? Where is the quantum critical point ? What happens near the critical point ? R. T. Macaluso et al., J.Solid State Chem. 177 293 (2004)
Crystal structure of CeNiSb3 CeNiSb3 Orthorhombic structure Space group Pbcm (#57) a (Å) = 12.6340b (Å) = 6.2037c (Å) = 18.3698 Specific heat coeffecient(電子比熱係数)γ = 50 mJ / mol K2(γis proportional to effective mass.) R. T. Macaluso et al., J.Solid State Chem. 177 293 (2004) Ferromagnetic ground state TC = 6 K
Temperature dependence of electrical resistivity in CeNiSb3 Double peak T ~ 100K Crystal field T ~ 10K Kondo effect ρincreases as the pressure increases.
Second transition TM2 TM1 Tc first increases. A second transition appeared P >39.5 kbar. Both anomaly decreases as the pressure increases. And TM2 disappeared at 55.2 kbar. Tc
The first derivative dρ/dT TM2 TM1 P > 39.5 kbar Shape of the peak at TM1 changes. →like shoulder And second transition TM2 appears. → sharp peak P = 55.2 kbar, Peak at TM2 disappears. Peak at TM1 becomes broader. Tc
Magnetic phase diagram Tc first increased. TM1 and TM2 appeared P > 35 kbar. TM2 disappears P = 55 kbar. They can’t reach the quantum critical point because of the pressure cell. (P < 60kbar)
Fermi liquid and Non fermi liquid At low temperature region… Fermi liquid ρ-ρ0 = AT2 ρ-ρ0 = ATn n < 2 Non fermi liquid At the quantum critical point Magnetic order region ρ-ρ0 = ATn 2 < n < 3
Fermi liquid behavior Fermi liquid behavior recovered at P = 55.2 kbar. Kadowaki-Woods relation A / γ2 = 1×10⁻⁵μΩcm (mol K / mJ)2 γ = 300 mJ / mol K2 6 times heavier than value at ambient pressure !
Complex magnetic phase diagram and etc. n value approaches to 2 .→Fermi liquid behavior is recovered. To non fermi liquid P > 60 kbar In some Ce Compounds, A and ρ0 has a sharp peak.Sign of near the quantum critical point.
SummaryComplex magnetic phase diagram ・Tc first increases, and second magnetic phase appeared P > 35kbar. ・Critical pressure for the suppression of the low temperature phase is estimated Pcmag2 ~ 55 kbar. ・Quantum critical point associated with the higher temperature phase is estimated Pcmag1~ 60 kbar.
My sample CePdSb3 My experimental sample CePdSb3 Orthorhombic structure Space-group Pbcm a = 12.780 Å b = 6.330Å c = 12.453 Å Antiferromagnetic ground state TN = 3 K
My sample CePdSb3 TN increases. Second transition appeared with applying pressure. With our pressure cell (DAC), we will be able to reach the quantum critical point !