Download
1 / 6
60 likes | 73 Views
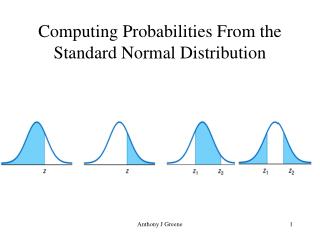
Calculate probabilities and values for normally distributed random variables based on mean and standard deviation. Find the probability of X being less than or equal to a given value, or find the value corresponding to a desired probability.

E N D
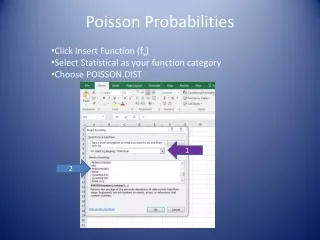
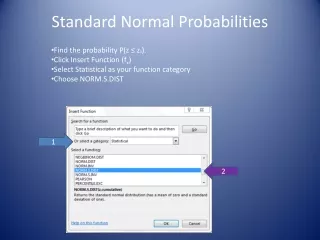
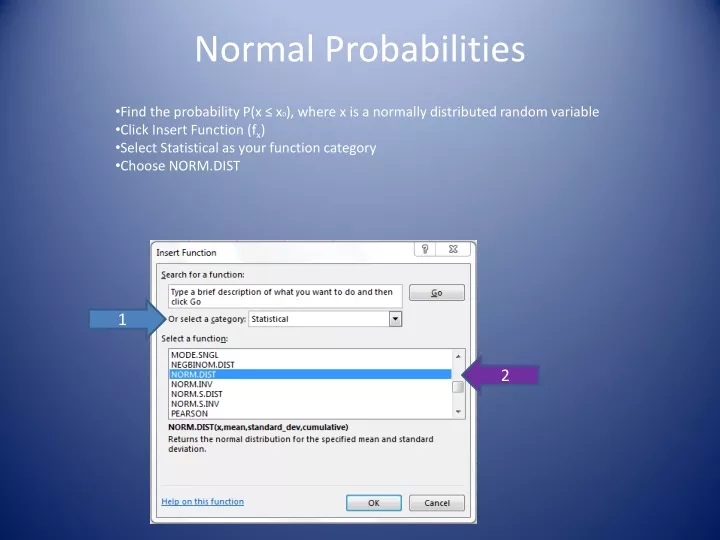
Normal Probabilities 1 Find the probability P(x ≤ x0), where x is a normally distributed random variable Click Insert Function (fx) Select Statistical as your function category Choose NORM.DIST 2
Normal Probabilities You must enter X = The value of the normal distribution for which you would like the cumulative probability P(x ≤ X). Mean = The mean of the normal distribution. Standard_dev = The standard deviation of the normal distribution Cumulative = True if you want P(x ≤ X). = False if you want the height of the curve at x. Use if you would like to graph the function (not used much in this class).
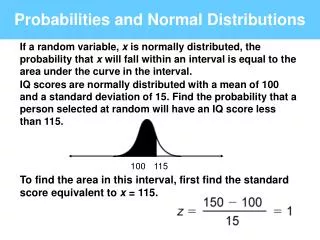
Normal Probabilities Example: The wind speed at a wind energy farm is approximately normally distributed with a mean of 25 miles per hour and a standard deviation of 7 miles per hour. What percent of the time will the wind speed be below 15 miles per hour? You must enter X = 15 Mean = 25 Standard_dev = 7 Cumulative = True So P(x < 15) = .0766
Normal Probabilities 1 Find the X-value giving you probability P(x ≤ X) = P0. Click Insert Function (fx) Select Statistical as your function category Choose NORM.INV 2
Normal Probabilities You must enter Probability = The probability P0 for which you would like the value of the standard normal distribution giving you P(x ≤ X) = P0. Mean = The mean of the normal distribution Standard _dev = The standard deviation of the normal distribution
Normal Probabilities Example: An instructor curves the class grades so that the top 10% of the students in class receive an A for the semester. During the past semester, the grades were approximately normally distributed with a mean of 217 points and a standard deviation of 32 points. How many points were needed to earn an A for the semester? You must enter Probability = .9 Excel wants the probability below the value of X. You want the value with 10% of the students above which is the same as 90% of the students below. Mean = 217 Standard _dev = 32 Your answer is 258