Download

1 / 56
560 likes | 768 Views
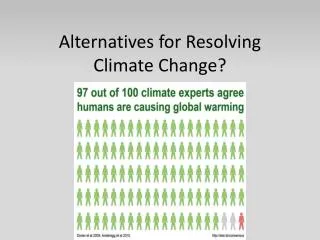
Climate, Climate Change Nuclear Power and the Alternatives. Climate, Climate Change Nuclear Power and the Alternatives. PHYC 40050 Peter Lynch Meteorology & Climate Centre School of Mathematical Sciences University College Dublin. The Composition and Structure of the Atmosphere.

E N D
Climate, Climate Change Nuclear Power and the Alternatives
Climate, Climate Change Nuclear Power and the Alternatives PHYC 40050 Peter Lynch Meteorology & Climate Centre School of Mathematical Sciences University College Dublin
COMPARISON OF HEMISPHERES 70% of the globe covered by water
COMPOSITION OF THE EARTH’S ATMOSPHERE 0.0002% PM H2 100% CH4 N2 CO O2 O3 N2O ←SO2, NO2, CFC’s, etc 1% Ar CO2 Inert gases 0.04%
~78% ~21% ~1% .04%
ATMOSPHERIC COMPOSITION • Molecular oxygen and nitrogen are major components – 99% • Of the remaining 1% , 96% is the inert gas argon • Of the remaining 4%, 93% is carbon dioxide • All remaining gases – about 2 parts in 100,000 are known as trace species • These gases control the chemistry of the troposphere
THE EARLY ATMOSPHERE 4.6 billion years ago: • Earth’s gravity too weak to hold hydrogen and helium (unlike Sun, Jupiter, Saturn, Uranus) • Earth’s present atmosphere from volcanoes (outgassing) • Water vapor condensed to form oceans • CO2 went into oceans and rocks • N2 • Oxygen forms by break-up of water by sunlight, later from plants … photosynthesis.
ATMOSPHERIC EVOLUTION • Earth’s early atmosphere consisted of Hydrogen (H), Helium (He), Methane (CH4) and Ammonia (NH3) • As the earth cooled volcanic eruptions occurred emitting water vapour (H2O), carbon dioxide (CO2) and nitrogen (N2). • The molecular oxygen (O2) in the current atmosphere came about as single celled algae developed in the oceans about 3 billion years ago.
ATMOSPHERIC EVOLUTION • Oxygen is produced as a by-product of photosynthesis, the making of sugars from water vapor and carbon dioxide. • This oxygen produces ozone (O3) in the upper atmosphere which filtered out harmful ultraviolet radiation from the sun. • This allowed plantsandanimals to develop on land.
CARBON DIOXIDE CYCLE Sources • Plant/animal respiration • Plant decay • Volcanoes • Burning of fossil fuels • Deforestation Sinks • Plant photosynthesis • Oceans • Carbonates
HYDROLOGICAL CYCLE • Water is everywhere on earth • It is in the oceans, glaciers, rivers, lakes, the atmosphere, soil, and in living tissue • All these ‘reservoirs’ constitute the hydrosphere • The continuous exchange of water between the ‘reservoirs’ is called the hydrological cycle • The hydrological cycle is powered by the Sun • It comprises • Evaporation and transpiration • Precipitation • Percolation into ground • Run-off to the sea
1 nm 1 mm 1 um | Aerosols: particle sizes
AEROSOLS • Particles suspended in the atmosphere • Diameters of microns – one millionth of a meter. • Modify the amount of solar energy reaching the surface. • Act as condensation nuclei for cloud droplets. PRIMARY SOURCES: • Sea salt spray • Wind erosion • Volcanoes • Fires • Human activity
PRESSURE AND DENSITY • Pressure is the force exerted on a given area. • Air pressure results when air molecules move and collide with objects. • Air pressure is exerted in all directions. • Density is the concentration of molecules, or mass per unit volume. • The pressure, density, and temperature of a gas are all related to each other.
PRESSURE AND ALTITUDE • Pressure is measured in terms of inches of mercury, or in millibars or hectopascals. • Average sea-level pressure is 29.92 inches of mercury or 1013.25 millibars (hPa). • Atmospheric pressure always decreases with increasing altitude. • The air pressure measured on top of the Sugar Loaf is always less than the pressure in Kilmacanogue. • To subtract the effect of station elevation, air pressure is corrected to report what it would be at sea level (sea level pressure)
Blaise Pascal
ATMOSPHERIC PRESSURE • Pressure at a point is the weight of air above that point. • A column of air of cross-section 1 square metre weighs about 10 tonnes ! • In still air, two factors determine the pressure – temperature and density • Ideal gas law: Pressure = Constant X Density X Temperature • Pressure decreases with altitude.
ATMOSPHERIC DENSITY • The concentration of molecules in measured in terms of density, or mass per unit volume. • Density at sea level for temperature of 15ºC is about 1.2 kilograms per cubic metre. • Density decreases with altitude.
IDEAL GAS LAW • The relationship between pressure, temperature, and volume is given by the ideal gas law: p = R ρ T where p = pressure R = the gas constant ρ = (Greek letter rho) density T = temperature
IDEAL GAS LAW • Knowing the Ideal Gas Law, you should be able to say what happens to one variable if a change in one of the others occurs (while the third remains constant). • E.g., what happens to pressure if density increases (temperature constant)?
ATMOSPHERIC LAYERS • The atmosphere can be divided up according to pressure (500 mb layer is about halfway up in the atmosphere). • The atmosphere can also be divided up according to temperature (which does not follow a simple relationship with height). • Averaging out temperature values in the atmosphere, we identify four layers.
ATMOSPHERIC LAYERS • Troposphere – temperature decreases with height • Stratosphere – temperature increases with height • Mesosphere – temperature decreases with height • Thermosphere – temperature increases with height
TROPOSPHERE • From the surface up to about 12km (varies with latitude and season – higher in Summer, and in the tropics). • Temperature decreases with height because the troposphere is heated by the surface and not directly by sunlight. • Almost all of what we call “weather” occurs in the troposphere. • Contains 80% of the atmosphere’s mass
STRATOSPHERE • Between about 12km and 50km. • Temperature increases with height because the ozone layer absorbs ultraviolet light and warms up as a result. • Lack of mixing and turbulence. • Very little exchange occurs between the stratosphere and troposphere (but it is important where it does). • 99.9% of the atmospheric mass below the stratopause.
MESOSPHERE & THERMOSPHERE • Mesosphere between 50km and 85km. • Thermosphere goes up and up and up: there is no clear separation between the thermosphere and interplanetary space. • The highest temperatures in the atmosphere are found in the thermosphere due to high energy radiation being absorbed by gases. • Ionosphere (charged gas atoms) that reflects radio waves, and aurora are here.
Tropopause Stratopause Mesopause 1. Troposphere- literally means region where air “turns over” -temperature usually decreases (on average ~6.5°C/km) with altitude 2. Stratosphere- layer above the tropopause, little mixing occurs in the stratosphere, unlike the troposphere, where “turbulent mixing” is common 3. Mesosphere- defined as the region where temperature again decreases with height. 4. Thermosphere- region with very little of the atmosphere’s mass. High energy radiation received by the thermosphere: high temperatures. Very low density (not much “heat” felt).
In meteorology we often refer to altitude as a certain pressure value rather than height. The atmosphere moves mainly on constant pressure surfaces (isobaric surfaces) 850 mb 1500 m (5000 ft) 700 mb 3000 m (10,000 ft) 500 mb 5500 m (18000) 300 mb 9000 m (30,000)
ATMOSPHERIC FRONTS • Front – a boundary between two regions of air that have different meteorological properties, e.g. temperature or humidity. • Cold front – a region where cold air is replacing warmer air. • Warm front – a region where warm air is replacing colder air. • Stationary front – a front that is not moving. • Occluded front – a front where warm air is forced aloft.