Climate, Climate Change Nuclear Power and the Alternatives
Climate, Climate Change Nuclear Power and the Alternatives. Climate, Climate Change Nuclear Power and the Alternatives. PHYC 40050 Peter Lynch Meteorology & Climate Centre School of Mathematical Sciences University College Dublin. EdGCM. Lecture 6.

Climate, Climate Change Nuclear Power and the Alternatives
E N D
Presentation Transcript
Climate, Climate Change Nuclear Power and the Alternatives
Climate, Climate Change Nuclear Power and the Alternatives PHYC 40050 Peter Lynch Meteorology & Climate Centre School of Mathematical Sciences University College Dublin
EdGCM Lecture 6
A Global Climate Model for Research and Education The EdGCM Cooperative Project, Columbia University Support provided by: NSF Paleoclimate Program and NASA High-Performance Computing Program
Ed GCM Project Goal To improve the teaching and learning of climate change science by providing the education community with access to: A research quality global climate model (GCM) A user-friendly interface to operate the GCM and organize the results Educational materials to make the GCM a useful tool for learning about the climate system
What is EdGCM? Educational Global Climate Model • A Global Climate Model • Computer-based modelling program • Relational Database • Graphical User Interface • Post-Processing Software • Scientific Visualization Tools (EVA) • Software for constructing scientific manuscripts and publishing them to the web.
What is a GCM? General Circulation Model Global Climate Model And why should we be interested in it?
Climate change is in the news
CAUSE EFFECT Recent Climate Change: Observed forcings and results.
The Keeling curve (Charles Keeling) Carbon dioxide concentration
CAUSE EFFECT Future Climate Change: Uncertainty of forcing.
CAUSE EFFECT Past Climate Change: Observed results. Uncertain forcings.
Pliocene Research, Interpretation and Synoptic Mapping Feb SST Aug SST Elevation Land Cover Sea Ice
2005 - Warmest Year on Record http://data.giss.nasa.gov/gistemp/2005/
CAUSE EFFECT PROCESS PROCESS PROCESS PROCESS PROCESS PROCESS
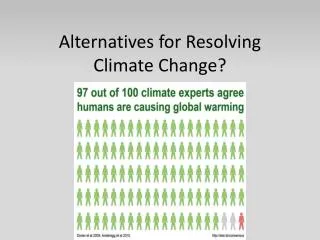
Climate Sceptics (from BBC website) While I am prepared to accept that there may be global warming, nothing I have seen shows a causal connection. Tim, UK One of the most persistent arguments made by those who do not believe that climate change is caused by human activity is that there is "no consensus" amongst climatologists about this. Tim Dennell, Sheffield, United Kingdom Five hundred years ago the scientific consensus was that the world was flat. Thirty years ago, we were about to enter another ice age. Twenty years from now we will all have a good laugh about "global warming". Thumper31
The GCM in EdGCM: GISS Model II Cartesian Grid General Circulation Models (Henderson-Sellers, 1985) (Hansen et al., 1983)
8°X 10° 4°X 5° 2°X 2.5° GISS Global Climate Model Grid Resolutions
DEC DEC JAN SST JAN SEA-ICE GCM Boundary Condition Data Files TOPO- GRAPHY SEA LEVEL VEG A GCM boundary condition set consists of global scale data sets on a latitude by longitude grid.
Paleogeography Throughout Earth History Jurassic (180 Ma) Paleocene (58 Ma) Cretaceous (100 Ma) Pliocene (3 Ma)
Prescribed Climate Forcings • Solar Luminosity • Orbital Parameters • Radiatively Significant Trace Gases • Volcanic Aerosols • Other Natural and Anthropogenic Aerosols
Ed GCM Project Objectives • Allow teachers to run a NASA global climate model on a desktop computer, encouraging students to participate in the full scientific processincluding: experiment design, running simulations, analyzing data and reporting results.
Ed GCM Project Objectives • Allow teachers to run a NASA global climate model on a desktop computer, encouraging students to participate in the full scientific processincluding: experiment design, running simulations, analyzing data and reporting results. • Facilitate collaborations between the education community and research institutions and among universities. In this way,students will become familiar with the role that teamworkplaysin scientific research.
Partnerships Scientific Research Involves Teamwork
Organizing and Designing Scientific Experiments Step 1: Setting Up Climate Model Simulations
Snowball_sim2.R Model II 8/24/2000Owner: Dr. Mark Chandler, chandler@giss.nasa.govGroup: Paleoclimate GroupThis experiment simulates a time period approximately 600 million years ago. There is evidence that a “super” ice age occurred that effected even tropical continents. Did the Earth freeze over entirely???Object modules:MainC9DiagC9RadC9FFTC9UTILC9Data input files:7=G8X10_600Ma9=NOV1910.rsf_snowball15=O8X10_600Ma17=25=Modern_OceanTransports19=CD8X10_600Ma23=V8X10_600Ma26=Z8X101_600Ma21=RTAU.G25L1522=RPLK2529=Snowball_Earth_RegionsLabel and Namelist:Snowball_sim2 (Snowball Earth Experiment: 600 million years ago) &INPUTZ TAUI=10176.,IYEAR=1900, KOCEAN=1, SRCOR=.95485638151, S0X=1.,CO2=.31746031746031, USET=0.,TAUE=35040., USESLP=-12., ISTART=3,KCOPY=2,NDPRNT=-1,TAUE=10177.,TAUP=95616., &END
Analyzing the Results of Scientific Experiments Step 2: Post-processing of raw GCM output Step 3: Visualization of climate model variables
Panoply Maps EVA Line Plots Tables Excel
Reporting Results of Scientific Experiments Step 4: Generating scientific-style manuscripts Step 5: “Publishing” and presenting results
eJournals Image Libraries
The EdGCM website is a focal point for collaborations, which will allow for: • Downloads of EdGCM software, materials, and updates • Simulation exchanges • Discussion groups • A location to publish results • Development work • News, EdGCM Excercises, and Community Showcases
A Few Final Points EdGCM is designed to support a broad range of National and State Science Education Standards
A Few Final Points EdGCM is designed to support a broad range of National and State Science Education Standards On-line Materials: Technical manual Software downloads Quicktime video tutorials - coming soon
A Few Final Points EdGCM is designed to support a broad range of National and State Science Education Standards On-line Materials: Technical manual Software downloads Quicktime video tutorials - coming soon Information Resources and Educational Materials Electronic Support Forums Frequently Asked Questions Guide Community Showcase Simulation and eJournal Exchanges Climate Science in Action - EdGCM Excercises