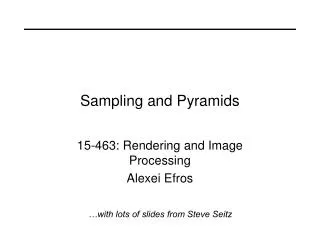
Sampling, Template Matching and Pyramids
530 likes | 554 Views
Learn about Fourier transform, sampling theory, aliasing, and pyramid construction in image processing for computer vision applications. This comprehensive guide covers fundamental concepts illustrated with examples and insights from renowned Computer Vision experts.

Sampling, Template Matching and Pyramids
E N D
Presentation Transcript
Sampling, Template Matching and Pyramids T-11 Computer Vision University of Ioannina Christophoros Nikou Images and slides from: James Hayes, Brown University, Computer Vision course Svetlana Lazebnik, University of North Carolina at Chapel Hill, Computer Vision course D. Forsyth and J. Ponce. Computer Vision: A Modern Approach, Prentice Hall, 2011. R. Gonzalez and R. Woods. Digital Image Processing, Prentice Hall, 2008.
Jean Baptiste Joseph Fourier (1768-1830) ...the manner in which the author arrives at these equations is not exempt of difficulties and...his analysis to integrate them still leaves something to be desired on the score of generality and even rigour. had crazy idea (1807): Anyunivariate function can be rewritten as a weighted sum of sines and cosines of different frequencies. • Don’t believe it? • Neither did Lagrange, Laplace, Poisson and other big wigs • Not translated into English until 1878! • But it’s (mostly) true! • called Fourier Series • there are some subtle restrictions Lagrange Laplace Legendre
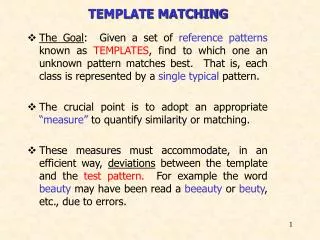
A sum of sines Any function that periodically repeats itself can be expressed as a sum of sines and cosines of different frequencies each multiplied by a different coefficient Add many terms to approximate any signal
Other signals • We can also think of all kinds of other signals the same way xkcd.com
The Fourier Transform • Represent a function on a new basis • Think of functions as vectors, with many components • We now apply a linear transformation to transform the basis • dot product with each basis element • In the Fourier transform, u and v select the basis element, so a function of x and y becomes a function of u and v • For a fixed pair of frequencies (u,v) the basis elements have the form
The Fourier Transform • The FT is a complex function having a magnitude and a phase for each (u,v) pair. • The FT is linear. • It “measures” the amount of sinusoids at spatial frequencies (u,v) carried by the image. • It may be discretized to provide the DFT.
The Fourier Transform The real part of some basis elements (complex exponential). (u,v) = (0, 0.4) (u,v) = (1, 2) (u,v) = (10,-5)
The Fourier Transform Image FT magnitude FT phase
The Fourier Transform Phase of zebra - magnitude of tiger Phase of tiger - magnitude of zebra
The Fourier transform of the convolution of two functions is the product of their Fourier transforms The inverse Fourier transform of the product of two Fourier transforms is the convolution of the two inverse Fourier transforms Convolution in spatial domain is equivalent to multiplication in frequency domain! The Convolution Theorem
The Fourier Transform • The value of the FT at a particular frequency pair (u,v) depends on the whole image. • A local change in the image affects all the values of the FT. • It is difficult to use it alone as an image representation locally. • The magnitudes of the FT of images tend to be similar. Phase component seems to be different. • The FT helps us to explain the difference between a continuous image and its discrete version.
Sampling Why does a lower resolution image still make sense to us? What do we lose? Image: http://www.flickr.com/photos/igorms/136916757/
The procedure: subsampling by a factor of 2 Throw away every other row and column to create a 1/2 size image
Sampling Top left board sampling seem reasonable. Top right also, although it is sparser. Bottom left will provide an all black (dubious) signal. Bottom right will provide checks that are too big.
Aliasing problem • 1D example (sinewave): Source: S. Marschner
Aliasing problem • 1D example (sinewave): Source: S. Marschner
Sampling • Aliasing • Wagon wheels rolling the wrong way in movies. • Checkerboards misrepresented. • Striped shirts look funny on color television. • The Nyquist theorem says that we should sample with at least twice the maximum frequency carried by the continuous signal. • If this is not known remove some high frequenccies before sampling • Loss of information but beter than aliasing
Sampling • A common and interesting case is when we want to halve the width and height of an image (recursively). • A Gaussian filter is generally applied to remove high frequencies and avoid aliasing. • Remember that the FT of a Gaussian of standard deviation σis also a Gaussian of standard deviation 1/σ. • The selection of the filter standard deviation is important.
Sampling Constructing a pyramid by taking every second pixel leads to layers that badly misrepresent the top layer.
Sampling Sampling without smoothing. Notice the aliasing at the coarse resolution levels. Image FT magnitude
Sampling Sampling with smoothing by a Gaussian with σ=1. Aliasing is reduced (along with some high frequencies). Image FT magnitude
Sampling Sampling with smoothing by a Gaussian with σ=1.4 reducing aliasing but removing more high frequency components thanσ=1. Image FT magnitude
Subsampling without pre-filtering 1/2 1/4 (2x zoom) 1/8 (4x zoom) Slide by Steve Seitz
Subsampling with pre-filtering Gaussian 1/2 G 1/4 G 1/8 Slide by Steve Seitz
Application: Hybrid Images A. Oliva, A. Torralba and P. G. Schyns. Hybrid images. SIGGRAPH 2006. People may appear sad, up close, but step back a few meters and look at the expressions again.
Application: Hybrid Images A. Oliva, A. Torralba and P. G. Schyns. Hybrid images. SIGGRAPH 2006.
Salvador Dali invented Hybrid Images? Salvador Dali “Gala Contemplating the Mediterranean Sea, which at 30 meters becomes the portrait of Abraham Lincoln”, 1976
Application: Hybrid Images A. Oliva, A. Torralba and P. G. Schyns. Hybrid images. SIGGRAPH 2006.
Clues from Human Perception • Early processing in humans filters for various orientations and scales of frequency • Perceptual cues in the mid-high frequencies dominate perception • When we see an image from far away, we are effectively subsampling it Early Visual Processing: Multi-scale edge and blob filters
Campbell-Robson contrast sensitivity curve Perceptual cues in the mid-high frequencies dominate perception
Filters as Templates • Applying a filter at some point can be seen as taking a dot-product between the image and some vector. • It has a strong response at locations where these vectors are parallel. • Filtering the image is a set of dot products. • Insight • filters find effects they look like (they have a large positive response at these effects).
Filters as Templates Image and filter Positive responses Zero-mean image (-max:max)
Filters as Templates Image and filter Positive responses Zero-mean image (-max:max)
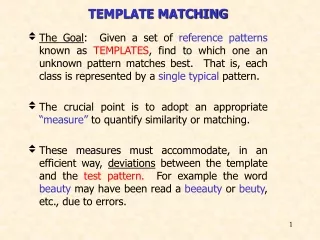
Template matching • Goal: find in image • Main challenge: What is a good similarity or distance measure between two patches? • Correlation • Zero-mean correlation • Sum of square differences • Normalized cross correlation Slide: Hoiem
Matching with filters • Goal: find in image • Method 0: filter the image with eye patch f = image g = filter What went wrong? The value may be large only because of locally high intensities. Something should be changed Filtered Image Input Slide: Hoiem
Matching with filters • Goal: find in image • Method 1: filter the image with zero-mean eye mean of f True detections False detections Thresholded Image Filtered Image (scaled) Input Slide: Hoiem
Matching with filters • Goal: find in image • Method 2: SSD True detections Thresholded Image 1- sqrt(SSD) Input Slide: Hoiem
Matching with filters What’s the potential downside of SSD? • Goal: find in image • Method 2: SSD Sensitive to local contrast changes 1- sqrt(SSD) Input Slide: Hoiem
Matching with filters • Goal: find in image • Method 3: Normalized cross-correlation mean template mean image patch Matlab: normxcorr2(template, im) Slide: Hoiem
Matching with filters • Goal: find in image • Method 3: Normalized cross-correlation True detections Thresholded Image Input Normalized X-Correlation Slide: Hoiem
Matching with filters • Goal: find in image • Method 3: Normalized cross-correlation True detections Thresholded Image Input Normalized X-Correlation Slide: Hoiem
Normalized Cross Correlation • Filters as dot products • NCC is the the cosine of the angle between the tempalte and the image patch considered as vectors.
Application: Controlling the TV by Finding Hands • System responding to human gesture. The computer vision system needs to determine whether either a small set of events occur or nothing. An open hand turns the TV on. • Robust system. • distance from camera fairly constant. • hand up and open and the hand size is known. • normalized correlation is used. W. Freeman et al. Computer vision for interactive computer graphics. IEEE Computer Graphics and Applications, 1998.
Application: Controlling the TV by Finding Hands Other operations are possible (volume control, etc.) W. Freeman et al. Computer vision for interactive computer graphics. IEEE Computer Graphics and Applications, 1998.
Scale and Image Pyramids • Images look different at different scales • A zebra may be described in terms of • individual hairs (small scale oriented filters) • stripes (large scale oriented filters) • A practical approach is to apply small filters to smoothed and resampled versions of the image. • Image pyramid • representation at different scales
The Gaussian Pyramid • Each layer is smoothed by a symmetric Gaussian filter and resampled to get the next layer. • The smallest image is the most heavily smoothed.
The Gaussian Pyramid • Scale-space representation • A bar is • a hair (large images) • the whole nose (small images)
Template Matching using the Gaussian Pyramid Input: Image, Template • Match template at current scale • Downsample image • Repeat 1-2 until image is very small • Take responses above some threshold, perhaps with non-maxima suppression Slide: Hoiem