Download
1 / 24
320 likes | 716 Views
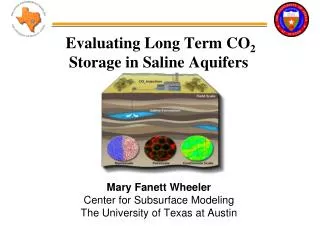
CO 2 Storage in Saline Aquifers. Mac Burton Representing Dr. Steven L. Bryant And Geological CO2 Storage Research Program. Stabilizing Greenhouse Gas Emissions is a World-Scale Task. INDUSTRY 29%. TRANSPORT 33%. ELECTRICITY 38%.

E N D
CO2 Storage in Saline Aquifers Mac Burton Representing Dr. Steven L. Bryant And Geological CO2 Storage Research Program
Stabilizing Greenhouse Gas Emissions is a World-Scale Task INDUSTRY 29% TRANSPORT 33% ELECTRICITY 38%
Meaningful Mitigation of GHG Emissions will Require Geologic Sequestration(plus several other technologies simultaneously) Each option would remove 1 Gt carbon/year
Meaningful Geologic Sequestration will Require a New Industry Comparable in Size to Current Oil & Gas Industry Global gas production in 2006 277 BCFD Global oil production in 2006 81.7 MMBD
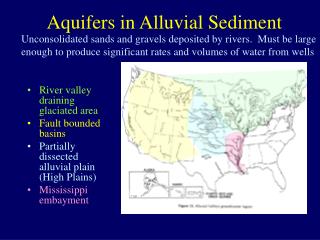
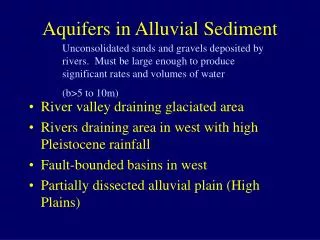
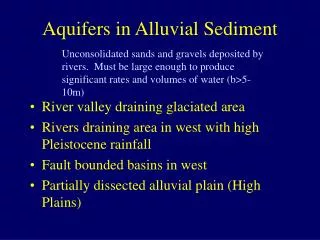
General Overview of Geologic Storage in Deep Saline Aquifer • Storage Mechanisms and General Plume Prediction • Dissolution and Capillary Trapping • Structural Trapping and Mineral • Time to Reach Seal and Lateral Extent • Injection Strategies • Well Design • Reservoir Characterization • Leakage from Natural and Man-Made Features • Leaking Faults • Leaking Top Seal • Leaking Wells Standard Evaluation Techniques Standard Evaluation Techniques Requires New Evaluation Techniques and Science
Leakage of CO2 can pose a risk to: Underground Assets Health Safety & Environment Atmosphere (Emission Credits) Why is Our Work in the Subsurface Important? Wells and faults are primary potential leakage pathways Two Examples of Importance of Our Work
Example #1: Active Well Leak and Abandon Number of Wells in Gulf of Mexico with SCP 600 400 200 0 Hundreds of Wells are Abandon in the Gulf of Mexico each Year; Wells in the Gulf are Few in Number Compared to On-shore 5% to 30% of Active Wells per Field in Gulf of Mexico have Leaks that Run to the Surface Bourgoyne et al, MMS report 0 10 20 30 40 50 % of Wells with SCP Nicot et al, 2006
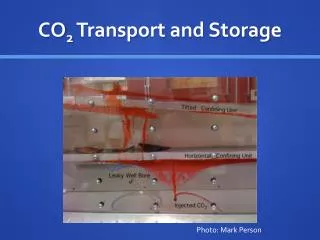
Example #2: Injection Design Pressure profile in aquifer DEPTH Pressure profile in well PRESSURE
Surface Dissolution: Implementation Costs and Technical Challenges Mac Burton Steven Bryant
Key Findings • Surface dissolution technology increases the available target aquifer space. Where? • Shallower aquifers • Aquifers with poor seal quality • Operational and capital costs for surface dissolution are larger but comparable in magnitude to those for standard approach. • Surface dissolution may be attractive where the costs of insuring against buoyancy-driven CO2 leakage exceed these additional costs. • Adds reasonable technology or options to our arsenal.
Motivations for Alternate CO2 Storage Strategies in Saline Aquifers • Cheap Solution • Simple Solution • Safe Solution We choose to look at a strategy that will: • Lower Risk Option • Address Technical Subsurface Challenges • Adds to Current Technology or Expanding our Options
Standard Approach to Sequestration-Retrofitting Coal-Fired Power Plant STANDARD APPROACH
Costs for Standard Approach toAquifer Sequestration Sources: Dr. Rochelle’s presentation to Dr. Bryant research review, and Remediation of Leakage from CO2 Storage Reservoirs, IEA GHG Programme
Standard Approach to Saline Aquifer:Technical Challenges • Buoyant Migration • Monitoring for Hundreds of Years • Interaction with Faults, Seals, and Existing Wells • Liability for Storage: Cost and Probability of • Remediation • Lost Emission Credit • Damage to Subsurface Assets • Injectivity • Reaching Pressure Limit In Closed Aquifer • Relative Permeability and Capillary Pressure
Surface Dissolution Approach to Sequestration-Retrofitting Coal-Fired Power Plant SURFACE DISSOLUTION
Solubility of CO2 in Brine: • with temperature • with pressure • with salinity Modeling Surface Dissolution: Overview • Solubility of CO2 in Brine (Aquifer & Surface) • Amount of Brine Needed • Operational and Capital Costs
STANDARD APPROACH BELOW 2600FT Modeling Surface Dissolution: Solubility in Brine in the Aquifer Increasing salinity Solubility CO2 (mole %) Aquifer Depth (ft)
Modeling Surface Dissolution: Brine Rate Comparable to Other Plant Usage
Operational Costs CO2 Compression Polytropic Compression η=79.6% 4 stages Brine compression Incompressible 80% efficient Capital Costs Injection and Extraction wells $750,000 per well 35,000bbl/d-well CO2 Compressors and Brine Pumps $900,000 per MW consumed for pumping Pressure Mixing Vessel ~$25,000 per MW of power plant Operational and Capital Costs for Surface Dissolution
Surface Dissolution in Saline Aquifer:Technical Challenges • Surface Challenges • Strong Temperature Dependence (Shallow is Better) • Strong Salinity Dependence (Shallow is Better) • WellCosts Influential (Shallow is Better) • DissolvingCO2 in short time (less than few minutes) • Carbonicacid might cause corrosion • Subsurface Challenges • Large Areal Target and Large Injection Volume • Can we get the brine in and out? • What if the CO2 -dense brine shows up at the extraction wells?
Cost Comparison of Approaches 5-8% More OPEX Double CAPEX
Cost Comparison of Approaches $20-$35 added / tonne
Pro’s Safety Sells No Buoyant Migration Interaction with Seal, Faults, Wells Increases Aquifer Availability Conclusion—Motivation Evaluation ? • Cheap Solution • Simple Solution • Safe Solution • Con’s • Added Costs • Additional Fluid Handling • Added Facilities (Compressors, Wells, etc.) • Requires More Aquifer Space • Technical Challenges (Carbonic Acid, Predicting Temperature, Predicting Reservoir, etc.)