Download
1 / 14
140 likes | 161 Views
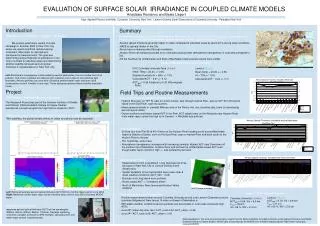
This presentation discusses the total solar irradiance (TSI) variability based on data from various space missions and how uncertainties are estimated. It delves into long-term trends of TSI and spectral irradiance, offering conclusions on composite TSI construction and comparison. The talk explores data sets from different missions to create composite TSI results, with a focus on corrections applied for accurate measurements. The analysis includes gaps in data collection and comparisons with independent observations for different cycles, providing insights into the trends in solar irradiance variability and uncertainties over time.

E N D
Total solar irradiance during the last three cycles: Uncertainties of the long-term behaviour Claus Fröhlich Physikalisch-Meteorologisches Observatorium Davos World Radiation Center CH 7260 Davos Dorf AGU Fall Meeting, San Francisco, December 15-19 2008
Outline • Discussion of TSI variability from simultaneous measurements of different space experiments • How can the uncertainty be estimated? • What about long-term trends of TSI and spectral irradiance? • Conclusions AGU Fall Meeting, San Francisco, December 15-19 2008
Construction of a composite TSI • Since 1978 reliable TSI measurements from space are available from the following overlapping missions with electrically-calibrated radiometers (ECR): • HF (Hickey-Frieden) on NIMBUS7 (17/11/1978 - 24/01/1993) • ACRIM-I on SMM (16/02/1980 - 01/06/1989) • ERBE on ERBS (24/10/1984 - 12/03/2003) • ACRIM-II on UARS (06/10/1991 - 27/09/2001) • SOVA on EURECA (11/08/1992 - 15/05/1993) • VIRGO (PMO6V, DIARAD) on SOHO (07/02/1996 - ………) • ACRIM-III on AcrimSat (05/04/2000 – ………) • TIM on SORCE (25/02/2003 - ………) • For all composite results from HF, ACRIM-I and II are used for cycles 21 1nd 22 and during the last cycle (23)VIRGO, ACRIM-III or DIARAD/VIRGO. • ERBE data are used as an independent dataset for comparison – mainly during the period of ‘ACRIM gap’. As its sampling is so sparse (once every 14 days for a few minutes) the corrections introduced during the construction of the PMOD composite, daily data from a proxy model are used for interpolation between the measured ERBE points. AGU Fall Meeting, San Francisco, December 15-19 2008
Construction of a composite TSI AGU Fall Meeting, San Francisco, December 15-19 2008
Comparison of the three composites If we take these data as a reference we would get an overall uncertainty of something like ± 0.3 Wm-2 or if we took also the beginning much more. Is that what we want? No, we need to look at the details! AGU Fall Meeting, San Francisco, December 15-19 2008
Corrections applied for the PMOD Composite Let us look at each cycle separately: cycle 21 has the problem of early HF data. Before we can analyze this problem we need a reliable ACRIM-I data set AGU Fall Meeting, San Francisco, December 15-19 2008
Corrections applied for the PMOD Composite Now we can treat the results from HF on NIMBUS7. It has no correction for degradation, so we need to do it. Moreover it has many slips mainly due to operational effects. These can be removed by looking at the locally data. Having done this we can take ACRIM-I corrected as a reference and expand it by 14 months with the proxy model calibrated by ACRIM around the maximum in 1980. AGU Fall Meeting, San Francisco, December 15-19 2008
This is the ACRIM gap Corrections applied for the PMOD Composite Now we have reliable results from HF on NIMBUS7 and we can use these to bridge the ‘ACRIM gap’ together with the results from ERBE. Remember the difference of about 30 ppm between the determination with ERBS and HF AGU Fall Meeting, San Francisco, December 15-19 2008
Corrections applied for the PMOD Composite Although we use VIRGO from its beginning in early 1996 we still need some corrections for ACRIM-II and have to adjust ACRIM-III to ACRIM-II in order to get a reliable reference during cycle 22. AGU Fall Meeting, San Francisco, December 15-19 2008
Corrections applied for the PMOD Composite Now for VIRGO we have two different results, the official VIRGO TSI and the one from DIARAD alone, produced by IRMB. What is the difference and where does it come from? AGU Fall Meeting, San Francisco, December 15-19 2008
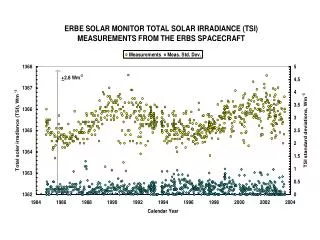
Comparison of the composites with ERBE: Uncertainty over cycle 22 Slope of the yellow line: -4.3 ± 54.6 ppm/decade, Stddev: 134.8 ppm; Difference in correction of ACRIM-1 to 2: 30 ppm; Overall estimate of uncertainty: 55 + 30 = 85 ppm AGU Fall Meeting, San Francisco, December 15-19 2008
Comparison of the composites with ERBE: Uncertainty over cycle 23 Slope of ACRIM-II/III up to February 2007: 15.3 ± 0.05 ppm/decade; stddev; 86.0 ppm Slope of TIM: 108.7 ± 0. 2 ppm/decade; stddev: 27.8 ppm; overall estimate of uncertainty: 55 + 28 = 83 ppm AGU Fall Meeting, San Francisco, December 15-19 2008
Conclusions • For the cycles 22 and 23 we can to compare the PMOD composite with independent observations. For cycle 21 this is not possible, but a similar uncertainty may be assumed. • For these two cycles we estimate the uncertainty of a trend between the adjacent minima of about 85 ppm. This is not cumulative, but still somewhat larger than assumed up to date. • For the decrease of the most recent decrease of TSI we get 250 ± 85 ppm, which is even at lower limit much more than what other activity indices show. In terms of amplitude of the cycle this amounts to 35 ± 12 %. • This estimate for the present cycle may be over pessimistic as TIM/SORCE may still need some more detailed analysis of its degradation. Moreover, preliminary results fro a re-analysis of the PMO6-V radiometry indicates that the relative slope to TIM may change without changing the minimum value AGU Fall Meeting, San Francisco, December 15-19 2008
This is the end……….Thanks This presentation can be found on: ftp://ftp.pmodwrc.ch/pub/Claus/AGU_Fall2008/AGU_Fall2008_GC32A-06.ppt For further questions: cfrohlich@pmodwrc.ch AGU Fall Meeting, San Francisco, December 15-19 2008