
Population Pharmacokinetics of Temocillin in ICU Patients and Monte Carlo Simulations for Resistance Breakpoints
Explore the concentration of Temocillin in ICU patients to evaluate resistance breakpoints and determine probabilities of target attainment. Pharmacokinetic data and Monte Carlo simulations are utilized to suggest clinical breakpoints. Results show a susceptibility breakpoint of

Population Pharmacokinetics of Temocillin in ICU Patients and Monte Carlo Simulations for Resistance Breakpoints
E N D
Presentation Transcript
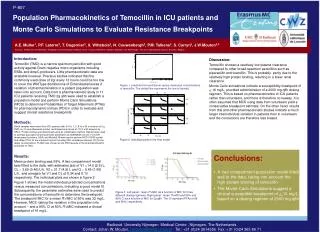
Concentration (mg/L) Time (h) P-807 Population Pharmacokinetics of Temocillin in ICU patients and Monte Carlo Simulations to Evaluate Resistance Breakpoints A.E. Muller1, P.F. Laterre3, T. Dugernier3, X. Wittebole3, N. Couwenbergh3, P.M. Tulkens3, S. Carryn3, J.W.Mouton2,4 1Erasmus Medical Centre Rotterdam, 2Radboud University Nijmegen Medical Centre, 4Canisius Wilhelmina Hospital, Nijmegen, The Netherlands, 3Université catholique de Louvain, Bruxelles, Belgium Introduction: Temocillin (TMO) is a narrow spectrum penicillin with good activity against Gram negative micro-organisms including ESBL and AmpC producers. Little pharmacokinetic data are available however. Previous studies indicated that the commonly used dose of 2gr every 12 hours could be too low to cover the WildType distributions of Enterobacteriaceae if variation of pharmacokinetics in a patient population was taken into account. Data from a pharmacokinetic study in 11 ICU patients receiving TMO 2g q8h were used to establish a population model and perform Monte Carlo Simulations (MCS) to determine Probabilities of Target Attainment (PTAs) for pharmacodynamic indices (PDI) in order to evaluate and suggest clinical resistance breakpoints. Methods: Blood samples were taken from ICU patients after (t=0.5, 1, 2, 8 h) a 30 m infusion of 2 g TMO (n=11) and afterwards cooled, centrifuged and stored at -70°C until analysis by HPLC. Protein binding was determined using an ultrafiltration method. Results were used to estimate population pharmacokinetic parameters by NONMEM (version VI, ICON development solutions, USA) and Miclab2.36 was used to perform MCS (10000 cycles) and obtain PTAs for the unbound fraction including 95% confidence intervals (CI) for the target concentrations. fT>MIC was chosen as the PDI because of the pharmacodynamic properties of TMO. Discussion: Temocillin showed a relatively low plasma clearance compared to other broad-spectrum penicillins such as piperacillin and ticarcillin. This is probably partly due to the relatively high protein binding, resulting in a lower renal clearance. Monte Carlo simulations indicate a susceptibility breakpoint of < 16 mg/L, provided administration of a 2000 mg q8h dosing regimen. This is based on pharmacokinetics of ICU patients rather than volunteers, and there is therefore no leeway. It is often assumed that MCS using data from volunteers yield a conservative breakpoint estimate. On the other hand, results from this and other pharmacokinetic studies indicate a much larger interindividual variation in patients than in volunteersand the conclusions are therefore less biased. Figure 1. predicted concentrations versus measured concentrations of temocillin. The dotted line represents the line of identity. Figure 2. individual plots of the final model • Conclusions: • A two compartment population model fitted well to the data, taking into account the high protein binding of temocillin • The Monte Carlo Simulations suggest a clinical susceptible breakpoint of < 16 mg/L based on a dosing regimen of 2000 mg q8h Results: Mean protein binding was 59%. A two-compartment model best fitted to the data, with estimates (se) of V1 =14.0 (2.5) L, CL = 3.69 (0.46) L/h, V2 = 21.7 (4.5) L and Q = 8.45 (1.06) L/h, and omega’s for V1 and CL of 0.34 and 0.13 respectively. The individual plots are shown in figure 2. Figure 1 shows the model individual predicted concentrations versus measured concentrations, indicating a good model fit. Subsequently, the parameter estimates were used to predict the concentrations of temocillin to determine the breakpoint. The breakpoint MIC for a mean fT>MIC of 50% was 32 mg/L. However, MCS -taking the variation in the population into account – and a 95% CI at 50% fT>MIC indicated a clinical breakpoint of 16 mg/L. Figure 3. Left panel : mean fT>MIC as a function of MIC for three different dosing regimens. Right panel : mean fT>MIC and 95% and 99% CI as a function of MIC for 2g q8h. The CI represent PTAs of 95 and 99%, respectively. Radboud University Nijmegen Medical Centre , Nijmegen, The Netherlands. Contact: Johan W. Mouton, j.mouton@mmb.umcn.nl Tel.: +31 (0)24 3614356 Fax: +31 (0)24 365 86 71