Download
1 / 25
260 likes | 474 Views
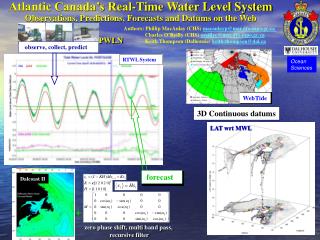
observe, collect, predict. WebTide. LAT wrt MWL. Authors: Phillip MacAulay (CHS) macaulayp@mar.dfo-mpo.gc.ca Charles O’Reilly (CHS) oreillyc@mar.dfo-mpo.gc.ca Keith Thompson (Dalhousie) keith.thompson@dal.ca. PWLN.

E N D
observe, collect, predict WebTide LAT wrt MWL Authors: Phillip MacAulay (CHS) macaulayp@mar.dfo-mpo.gc.ca Charles O’Reilly (CHS) oreillyc@mar.dfo-mpo.gc.ca Keith Thompson (Dalhousie) keith.thompson@dal.ca PWLN Atlantic Canada’s Real-Time Water Level SystemObservations, Predictions, Forecasts and Datums on the Web RTWL System 3D Continuous datums forecast Dalcoast II + zero phase shift, multi band pass, recursive filter
1430 Long Term Sea Level (GLOSS) Tsunami Gauges Storm Surge Gauges 0990 2145 0905 0665 0835 2000 0755 1700 1805 0612 1680 0065 0491 0490 0365 CHS Atlantic’s Permanent Water Level Network 16 tide gauges, 000’s kms of coastline Presentation Subtext:Socio-economic and Hydrographic motivations for maintaining coastal water level monitoring programs and networks
PWLN Equipment and Operational Upgrades Who is Crazy? 1) Legacy Sensor: Continuous chain float and pulley with optical encoder and tungsten weight, specific gravity =18 2) Secondary Sensor: Continuous fast response bubbler 3) Backup Sensor: Submersible pressure sensor 4) Laser sensor: Patm pump o o h o o o P=rwgh P=rwgh 0 0 0 • New Versatile Sutron XPert Dataloggers • Backup Communications GOES Satellite Systems (need 10 min permission) • High Frequency Water Level Measurements and Gauge Polling 1 minute averaged sampling, 10 minute gauge polling, average 5 min data latency • Sutron XConnect real time data collection software • Redundant Sensors Primary Rotary Encoder (Stable, Accurate, Reliable) Secondary Bubbler (Stable, Secondary Backup) Tertiary Pressure sensor (Extreme Water Levels, Fast Response Wells, Tertiary Backup) Laser sensor (Stable, Highly Accurate, Direct Independent Measurement Testing for GLOSS sites)
DFO Science (Matlab, Modeling) RTWLOracle Dbase Schematic of the Atlantic RTWL SystemA Collaborative Effort PWLN Tide Gauges ISDM Archival Data GOES Satellite link GOES Satellite Download XConnect Backup Data Acquisition PC (XConnect) CHS XP Network (XConnect) Archival Data Water Level Clients Dalhousie Dalcoast II CHS DFO Science ISDM Dalhousie Clients Real time data Data Backup DFO web server, RTWL web pages
RTWL Web Pages Kohila Thana, Science Informatics
Examples of other Real or Quasi-Real Time Systems • National Oceanographic and Atmospheric Administration’s (NOAA) Tides and Currents web site ----Physical Oceanographic Real-Time System (PORTS) • European Sea Level Service (ESEAS) • Monitoring Network System for Systematic Sea Level Measurements in the Mediterranean and Black Sea (MedGLOSS) • UK National Tidal and Sea Level Facility (NTSLF)
Observations, Constituent Predictions, The Residual The Residual: Observations – Predictions (non-tidal behavior) • Weather (storm surges, positive and negative) • Departures at tidal frequencies (variations in the tidal constituents) • Everything else affecting water level variations (infra-gravity waves, harbour seiches, tsunamis, shelf waves …) North Sydney, NS St. Lawrence, NFLD • Timescales (minutes to months) • Reason for continued monitoring of coastal water levels (Presentation Subtext) • Immediate impact on coastal environments, populations, and infra-structure • Danger to navigation • Validate storm surge models
x1, x2, ….,xt equispaced scalar values to be filtered Tide gauge locations st denote an auxiliary state vector Forecasting the Residual • Effects of weather Dalcoast II -- 2D, barotropic, non-linear, lateral diffusion, 1/12o ,forced by EC 3hr winds and pressure (48hr surge forecast, once per day) • Everything else Spectral-nudging Kalman Filter (Thompson etal., 2006) -- zero phase shift, multi band pass, recursive filter Build Term Decay Term Nowcast Filter band pass width, gain, (spin up period)-1 . Bias term Bobanovic and Thompson, 2001 Band Pass Frequencies Filtered values Forecast Proto-Forecast = Constituent Predictions + timeseries of 0-24 hr surge + 24-48 hr surge Forecast model residual error = Observations (up to last) – (Proto-Forecast) Residual error Nowcast = Filter (forecast model residual error), *Nowcast mode, build/modify state vector energy Residual error forecast = Filter, *Forecast mode, project existing state vector energy into the future (no decay) Final forecast = Proto-forecast + residual error nowcast and forecast
Selection of Filter Frequencies and Gains • From Theory: Diurnal O1, Semidiurnal M2 gain/filter band widths wide enough to capture other diurnal and semidiurnals • From Recent Observations (analysis of forecast model residual error timeseries): Upper Tidal and Seiche Frequencies, gain/decay timescales ~ 1.5 to 2 wave periods Forecast model residual error Seiche content Seiche energy/frequencies Residual tidal energy/frequencies
Example Forecast Past Datums Operational code under testing, Available on RTWL web pages soon Future
Dynamical Modeling Gridded Surfaces Discrete Calculation Continuous Datums for Atlantic Canada • What are they? Where are we starting from? • Why do we need them? • Where are we in Atlantic Canada? • How should we now best proceed? • Planning, Development Stage Although in principal prototypical versions have already used • 06-07 Labrador route survey Webtide • 07 Northumberland Strait Survey Webtide • 07 Fundy Survey Webtide, Omnistar
2D Simplification Ellipsoid Transforms Hat BM + datum + DEV(xxxx) target ambiguity Geodetic Tidal range mwl + MWL(xxxx) + + Continuous Surface Honoring Discrete Control + + CD(xxxx) + + + Lat Growing systematic errors Stn 0491 Lat, Long Discrete Vertical Control, Tide stations Spatially variable tidal properties Sea bed + <30 cm Long Timescale WL MonitoringVertical Control Datum Management • Hydrographic reason to maintain a minimal, effective water level monitoring network/program, maintain/track tidal datums wrt relative sea level rise (Presentation Subtext) • Present and past approach, What are continuous Datums? Constant Datum Transform Assumption (CDTA)
Why do we need them? • With GPS based vertical positioning, RTK or modeled (Omnistar), errors introduced to charts by the CDTA can become significant part of vertical error. • CDTA can be inappropriate some activities: • route surveys • surveys where tidal target surfaces change significantly over survey scale (estuaries, Bay of Fundy) • Flood mapping of large areas • RTK solutions and Anywhere, anytime water level applications (WebTide), Continuous applications need continuous datums Multi-constiuent, anywhere tidal prediction WebTide Constituents derived from a Hydrodynamic Barotropic Ocean Model Assimilating Topex Posieden Altimeter data Dupont, F., C.G. Hannah, D.A. Greenberg, J.Y. Cherniawsky and C.E. Naimie. 2002. Modelling system for tides for the North-west Atlantic coastal ocean. [online]. [Accessed 21 April, 2008]. Available from World Wide Web: http://www.dfo-mpo.gc.ca/Library/265855.pdf
Location transform required i j distj j Coastal datum control points j coastline j Ti – transform at i tj – transform at j wj – weight for tj far=max(distj) Distance weighted datum transform MWL to CD (Discrete calculation) Webtide provides anytime, anywhere tidal prediction wrt to a floating MWL We want tidal prediction wrt CD, need anywhere transform between MWL and CD Herman Varma Exponent p determines local flatness and width of transition zone • Used in: • Labrador 06-07 • Northumberland 07 • Fundy 07
How should we best proceed? • Closely examine the programs and methods employed by others, NOAA/NOS, UK (Excellent Workshop Monday) • Develop plans of approach (brainstorm, communicate needs/requirements • Discuss options with Datum clients • Develop project outlines/proposals • Acquire necessary resources and get on with it
How should we best proceed?Concept outline for an Atlantic Plan • Develop an initial theoretical target surface example: LAT as Sum of WebTide constituent amplitudes WebTide is based around a floating MWL, thus a surface computed from it must then be referenced to observed mean water levels. MWL is better known at some shore based locations than others. Away from the coast we must rely on either satellite altimetry or Geodetic models.
How should we best proceed?Concept outline for an Atlantic Plan • Compare existing shore-based Datum reference points to theoretical target surface. There will be misfit. Find and identify poor reference control, iteratively adjust target surface to more closely honor high quality shore-based reference control. Iterations between steps 1 and 2 may be necessary.
How should we best proceed?Concept outline for an Atlantic Plan • Adjust or supersede the target surface where good surrounding shore-based reference Datums permit independent surface estimation. Sequester inshore areas requiring further data or modeling. (NULL datum concept) • Calculate the seamless Datum surface grid. Grid spacing could be variable based on the local rate of change of the Datum surface. • Agree on standardized methods for interpolation between datum surface grid points and thus calculation of all Datum transformations. • Transform Dissemination tools? For Hydrographic work? Public? (VDatum?) • Border transitions? regional (Atlantic/Quebec), international (Atlantic/US) Combination of the 3D Datum surfaces with WebTide will yield an anytime, anywhere, on Datum water level prediction/sounding reduction tool.
Acknowledgements • Savi Narayanan, CHS directorate, direction and funding • John Loder, expertise on tsunami gauge locations • John O’Neill and Kohila Thana, system and web design • Mike Ruxton, Craig Wright, Larry Norton, Mark McCracken, James Hanway, CHS Geomatics • Steve Parsons, Herman Varma, Chris Coolen, Fred Carmichael, CHS Atlantic • CHS Quebec, Pacific and Central and Arctic • Carmen Reid, Canadian Coast Guard
Higher High Water High Water MHHW Low Water Lower Low Water NOS Generation of Tidal Datum Fields • MHW tidal datum fields (as well as MHHW, MLW, MLLW, MSL, MTL, DTL) from calibrated hydrodynamic models • Analysis of model-produced time series, then adjusted to provide a best fit to datums at NOS gauges.
Vertical Datum Transformations in VDatum Tidal Datums MLLW Mean Lower Low Water MLW Mean Low Water LMSL Local Mean Sea Level MTL Mean Tide Level DTL Diurnal Tide Level MHW Mean High Water MHHW Mean Higher High Water Orthometric Datums NAVD 88 North American Vertical Datum 1988 NGVD 29 National Geodetic Vertical Datum of 1929 3-D/Ellipsoid Datums NAD 83 (NSRS) North American Datum 1983 WGS 84(G873) World Geodetic System 1984 (G873) WGS 84(G730) World Geodetic System 1984 (G730) WGS 84(orig) World Geodetic System 1984 (original system -- 1984) WGS 72 World Geodetic System 1972 ITRF International Terrestrial Reference Frame 1988-94, 1996-98, 2000 SIO/MIT 92 Scripps Institution of Oceanography / Mass. Inst. of Tech. 1992 NEOS 90 National Earth Orientation Service 1990 PNEOS 90 Preliminary Nat’l Earth Orientation Service 1990
VDatum Interpolation to the User Input Location Conversion value at any location is determined by interpolation using surrounding values. For geodetic grids, set of nine points are used with bi-quadratic interpolation. For points in tidal grid, two methods are used. If four surrounding VDatum points are non-null, bilinear interpolation is used. If 1-3 points are null value, inverse-distance-squared weighting is used for non-null values.
Hibernia Sable RTWL Initiatives 2006/07 • Link Matlab to RTWL database and web pages • Employ Matlab’s powerful computational engine for RTQC • Interactive web content using Matlab • Real time quality control (RTQC), tsunami detection, and water level forecasting • Reliability of Nowcast data on the web • Identification of tsunami signals • Water level forecasts (storm surge model) • Observation-based tsunami detection and warning enhancement (Sable/Hibernia) • Early detection/verification • Landfall wave height estimation, Zhigang Xu (IML)
Storm Surges ~1 meter storm surges during spring tides, Feb/01/2006 Potential Flooding
Simulated Tsunami Arrival Simulated tsunami signal, Zhigang Xu (IML)