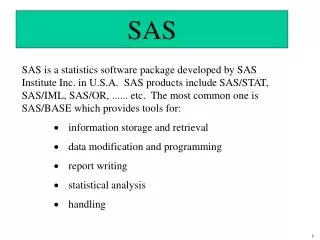
Clustering via SAS
130 likes | 342 Views
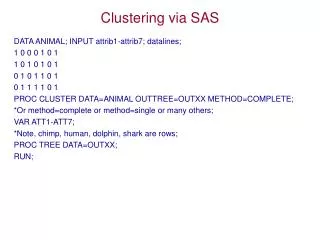
Clustering via SAS. DATA ANIMAL; INPUT attrib1-attrib7; datalines ; 1 0 0 0 1 0 1 1 0 1 0 1 0 1 0 1 0 1 1 0 1 0 1 1 1 1 0 1 PROC CLUSTER DATA=ANIMAL OUTTREE=OUTXX METHOD=COMPLETE; *Or method=complete or method=single or many others; VAR ATT1-ATT7;

Clustering via SAS
E N D
Presentation Transcript
Clustering via SAS DATA ANIMAL; INPUT attrib1-attrib7; datalines; 1 0 0 0 1 0 1 1 0 1 0 1 0 1 0 1 0 1 1 0 1 0 1 1 1 1 0 1 PROC CLUSTER DATA=ANIMAL OUTTREE=OUTXX METHOD=COMPLETE; *Or method=complete or method=single or many others; VAR ATT1-ATT7; *Note, chimp, human, dolphin, shark are rows; PROC TREE DATA=OUTXX; RUN;
Clustering via SAS output: AVERAGE LINKAGE CLUSTER ANALYSIS NAME OF OBSERVATION OR CLUSTER 0 0 0 0 B BBB 1 2 3 4 | | XXXXXXXXXXXXXXXX | XXXXXXX XXXXXXX | . . . .
Clustering via SAS DATA HAW (TYPE=DISTANCE); INPUT sports sc hybrid lux truck wd4 convsuv; CARDS; .000 .892 .990 .981 .986 .995 .993 .963 .892 .000 .970 .856 .925 .957 .983 .890 .990 .970 .000 .967 .993 .997 .995 .951 .981 .856 .967 .000 .970 .947 .978 .949 .986 .925 .993 .970 .000 .967 .969 .980 .995 .957 .997 .947 .967 .000 .979 .981 .993 .983 .995 .978 .969 .979 .000 .979 .963 .890 .951 .949 .980 .981 .979 .000 PROC CLUSTER DATA=HAW OUTTREE=OUTXX METHOD=AVERAGE; VAR sports--suv; PROC TREE DATA=OUTXX; Run;
XL Stat Cluster Analysis: • Analyzing data • K-means clustering • Fill in the “observations/variables table” with your data • Lower right, enter the #classes; i.e., insert what you want “k” to be (the #clusters). • Allow the default choices on the remaining menu items • Agglomerative hierarchical clustering • Fill in the “observations/variables table” with your data • Allow the default choices
XL Stat: Output K-means: Ward’s Method: