Download

1 / 44
440 likes | 462 Views
This study focused on developing a Benthic Macroinvertebrate Index for the Truckee, Carson, and Walker Rivers in western Nevada. The research involved data gathering, site classification, metric calculation, evaluation, and selection. Various methods were used, including field replicates, lab sorting, and data merge. The study analyzed 377 samples from 1981 to 2005 to assess the rivers' ecological health. Statistical techniques like non-metric dimensional scaling were employed to evaluate similarities among samples. Different ecoregions, reference and stressed sites, and site classifications were considered. A total of 19 metrics were selected based on their ecological significance. This comprehensive study aimed to provide a reliable tool for assessing the rivers' biological integrity.

E N D
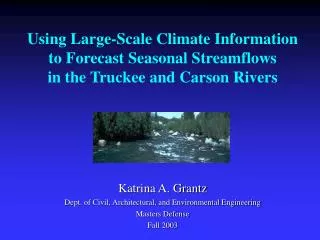
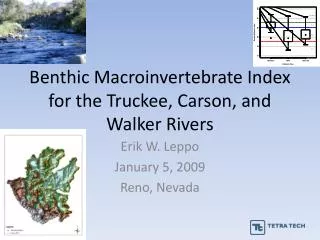
Benthic Macroinvertebrate Index for the Truckee, Carson, and Walker Rivers Erik W. Leppo January 5, 2009 Reno, Nevada
Study Area • Truckee, Carson, and Walker Rivers in western Nevada • Mainstem only • All flow east from the Sierra-Nevada Mountains in California into Nevada • Fixed station network (N=47) • Total of 377 samples • Not all stations sampled every year
Index Development Steps • Gather and organize data • Reference and stressed identification • Site classification • Calculate biological metrics for all samples • Determine metric sensitivity to stressors • Combine metrics into index alternatives • Select the most appropriate index • Evaluate the performance of the selected index
Data - Providers & Extent • Truckee, Carson, and Walker Rivers • Stateline to outlets • Nevada DEP and Pyramid Lake Paiute Tribe • PLPT data only on lower reach of Truckee River where NDEP data missing • Years of data, 1981 to 2005 • NDEP, 2000-2005 • PLPT, 1981-2005
Targeted Sample Period • Low Flow • July – October, based on USGS Gage data • Post 1997 • Extreme flood conditions in winter 1997/8, river changed course in some locations • Used 1998 – 2005 • Data Sources • NDEP (all 3 rivers but not lower Truckee) • PLPT (lower Truckee)
Data Differences • Field replicates • NDEP – 9 combined in field • PLPT – 1-4 separate • Combined 3 random replicates. • Only used samples with at least 3 replicates • Lab Sorting • NDEP – 500 org • PLPT – entire sample • Used computer to randomly subsample 500 org (± 20%). • Identifications • NDEP – genus (midges to species) • Used computer to group to genus • PLPT – genus
Data Merge • PLPT replicates “combined” and then subsampled to 500 organisms (± 20%). • All identifications lumped to genus level. • Restricted time of collection to July to October (low flow). • 377 total samples. After removing samples outside of index period, less than target number of organisms, and field duplicates had 222 samples.
Combining Rivers & Reaches • Used non-metric multidimensional scaling (NMS) plots to show relationships of sampling points. • Statistical technique to evaluate similarity of samples based on the organisms present. • Points closer together are more similar. Points farther apart are more dissimilar. • Can then code points by different grouping variables and look for reasons for why points are close or distant.
Shaded Relief Map Truckee, Carson, and Walker River basins
Reference and Stressed • These assessment models are built using least disturbed reference and know stressed. • Model is built to discriminate between the two. • Reference and stressed are identified without biological data to avoid circularity. • Water quality standards are used. • A variety of physical/chemical measures are used to identify sites.
Reference and Stressed • A priori • Reference • Pass 100% of parameters • Stressed • Pass < 50% of parameters • Other • Fail < 50% or • Insufficient data
Site Classification • Did not see enough difference in NMS plots to separate out the 3 river basins. • Within the Truckee River did not see enough differences to separate the upper and lower reaches. • Looked at a range of physical and grouping variables. • Looked at Reference sites but also all sites. • Included all sites as a single bioregion.
Site Classification • Reserved 20% of data set for model validation (N=46). • Multimetric index created using the development dataset (N=176).
Metrics • A metric is a measure of some attribute or element of the structure of, in this case, the bottom-dwelling (benthic) macroinvertebrate assemblage. • Metrics that change in some predictable way to increasing stress are looked at.
Metric Calculation • A suite of 64 metrics were calculated for each sample. • Metrics were calculated for multiple groups • habit, feeding, tolerance, richness, and composition. • Metrics were then evaluated for response to perturbation, discrimination ability, and ecological significance.
Metric Calculation Method • Calculations performed in EDAS, an Access database. • Use of a database reduces random error and puts a system in place to limit systematic error. • Use of master taxa list • Saved queries to reproduce calculations
Metric Evaluation • All metrics were evaluated for their ability to provide ecologically meaningful data. • Included metrics from the candidate pool • Sufficient range of detection • Range > 3 • Discrimination Efficiency (DE); number of sites assessed correctly divided by total number of sites being evaluated. • ≥ 50% • Variability • Coefficient of Variation (CV) (std dev / mean) of Ref < 0.9 • Response to increasing perturbation • Respond in anticipated direction
Metric Selection • 19 metrics were considered as candidate metrics for inclusion in the overall index.
Candidate Metric Correlations • Metrics that are strongly correlated are not used in the same index. • This can result in not using a metric since it is correlated with so many other metrics. • Strongly correlated metrics are not used together in the same index as they are most likely responding to the same stressor(s).
Metric Scoring • Need to translate metric values to a common scale for scoring and inclusion in an index. • Each metric value is converted to a 0-100 score where values closer to 100 are considered optimal. • Used 95th and 5th percentile of reference sites as “best” values. • Index is an average of the component metric scores.
Metric Scoring Formula • Metrics that decrease with decreasing stress: • Metrics that increase with decreasing stress:
Index Selection • Targeted • 4-6 metrics with 1 from each of the metric categories. Candidate pool of metrics included only 4 categories (no composition metrics). • Metrics with a high discrimination efficiency. • A final index with a high discrimination efficiency. • Avoided • Pairs correlated at greater than |0.80|. • Pairs measuring the same group (i.e., percent and taxa richness). • Final index score an average of component metrics. • Developed 5 index alternatives. • Not every metric was combined into one of the metric alternatives.
Final Index • Index alternative 5 was selected. • Ephemeroptera, Plecoptera, and Trichoptera (EPT) Taxa • Filterer Taxa • Burrower Taxa • Percent Sprawlers • Percent Dominant 01 Taxon
Index Performance Discrimination efficiency calculated using stressed samples • Index alternative 5 was selected. • Ephemeroptera, Plecoptera, and Trichoptera (EPT) Taxa • Filterer Taxa • Burrower Taxa • Percent Sprawlers • Percent Dominant 01 Taxon
Narrative Assessments • Assessment thresholds with narrative descriptions are intended to translate the numerical score into something that is more easily communicated to managers and the public. • Use the range of values of the reference sites to set thresholds.
Narrative Assessment Categories • Exceptional • ≥ 75th percentile of reference • 71.9 - 100 • Good • ≥ 25th percentile of reference • 60.2 – 71.8 • Fair • upper bisection of 25th percentile of Reference • 30.1 – 60.1 • Poor • lower bisection of 25th percentile of Reference • 0 – 30.0
Narrative Assessments • Preliminary • Categories • Could have 5 categories (tri-sect area under 25th percentile of reference). • Names • Want to use names that convey meaning to both managers and the public.
Conclusions • Have a tool to assess the biology of the mainstem rivers of the Truckee, Carson, and Walker Rivers. • Work in progress • As more data become available, can refine index (metrics or thresholds) and/or expand its spatial scope. Could be viewed as a building block for a state-wide index. • Narrative assessment categories can be modified to match agency goals.
Programs Used • Data Management • Excel, Acccess • Spatial Data • ArcView 3.x, ArcMap 9.2 • Statistics • PC-ORD, R, Excel
Contact Information • Nevada DEP • Karen Vargas • kvargas@ndep.nv.us • Tetra Tech • Erik Leppo • Erik.Leppo@tetratech.com • Michael Paul • Michael.Paul@tetratech.com