Download
1 / 33
330 likes | 346 Views
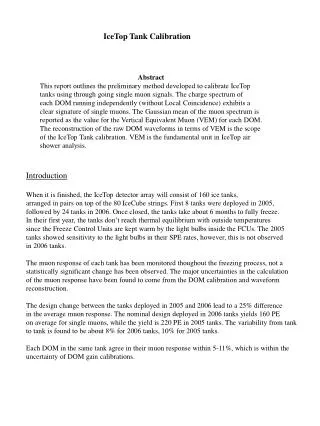
This presentation discusses the testing status of IceTop tanks, including development work, testing procedures, technical details, readouts, measurements, calibration, and methods used. It covers tank deployment, measurements of through-going muons, rates of coincidences, and calibration with the Muon Telescope. Various testing methods, freezing procedures, and issues related to tank freezing are outlined for both top-down and bottom-up tanks, with detailed data on gas removal and ice formation processes.

E N D
Status of IceTop tank testing Tom Gaisser, Madison, Feb 20, 2003
Outline • Tests at South Pole – Serap’s report at Berkeley, March 2002 (next 9 slides) • Development work in lab at Bartol – end of 2001, first half of 2002 • Testing in Port of Wilmington freezer – Sept 2002 – present • Paul Evenson: detailed report on top-down method and discussion of deployment
Where are the Tanks? MAPO Tank2000 10 m Tank2001 SPASE2 Shack
60 cm 51 cm crack 99.1 cm Heating rod (later removed) Tank2000 • Technical details: • Deployed in December 2000 • Cylindrical Polyethylene tank • radius=60cm height= 124cm • Lined with white Tyvek inside • for diffusive,high reflectance • Black velvet on top • 2 Standard AMANDA OMs frozen • in top looking down • Heating rod in the middle • to channel excess water during freezing • Filled with station water • 36 days to freeze • Block of ice of 1.14 m2 x 0.99 m
Tank2001 • Technical details: • Deployed in December 2001 • Cylindrical Polyethylene tank • radius=107cm height= 124cm • Lined with white Tyvek inside • Black velvet on top • 2 Standard AMANDA OMs frozen • in top looking down • PVC pipe in the middle with heating • tapes, thermo sensors • to channel excess water during freezing • Several different color LEDs • for later calibration • Filled with station water • 28 days to freeze • Block of ice of 3.6 m2 x 0.99 m 107.32 cm 102 cm 99 cm LEDs Heating tapes Thermosensors
Tank2000 Tank2001 Tank2000 Tank2001
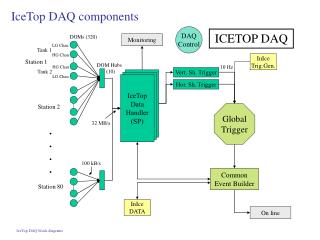
Readout & Triggers • Astand alone DAQ forwaveform acquisition • 2 digital scopes connected to a Linux PC through PCI-GPIB • 4 different triggers through separate Tank dedicated electronics • - Muon telescope • - Tank2000 2 OM coincidence • Tank2001 2 OM coincidence • 2 tank coincidence • Tank OM signals are integrated into SPASE DAQ • 4 OM TDCs and ADCs are read whenever there is a SPASE trigger
Tank Measurements • ICRC 2001 paper • Muon Telescope • Record waveforms of through going muons • Time dependence of muon signals • Muon flux at the South Pole • Coincidence with SPASE Through-going Muon rate @ South Pole Zenith Angle o Rate (Hz) 0 2.22 0.01 15 1.80 0.01 35 0.72 0.01 Amplitude and Charge change 2001 after 1 year 2000 during freezing
Tank Measurements Calibration w/ Muon Telescope all OMs @ high gain SPE ~ 7mV, FWHM ~ 30ns Vertical muon pulses ~ 150-200 mV FWHM ~50ns <1VEM> ~ 42 pe HV: OM1 @ 1130V OM2 @ 1350V HV: OM1 @ 1350V OM2 @ 1380V
Tank Measurements Tank Local Coincidences Tank2000 rate 390 Hz each OM @ 0.5 pe 215 Hz each OM @ 12 pe Tank2001 rate 1900 Hz each OM @ 0.5 pe 540 Hz each OM @ 12 pe
Tank Measurements 2 Tank Coincidence 3.8 Hz each OM @ 0.5 pe 1.2 Hz each OM @ 12 pe
High-gain PMT Low-gain PMT Core distance 5 – 20 m 20 – 35 m Average peak signal in millivolts 35 –50 m 50 – 65 m Shower size as S(30) = density of charged particles 30 m from shower core Coincidences with air showers(from Hamburg ICRC paper)
Small-scale tests in chest freezer in lab Various tests freezing water in small containers in the lab led to design of controlled top-down freeze
Commercial (bottom-up) method Photos: summer 2002
Test tanks at Port of Wilmington Both tanks slightly over half frozen at present Top-down tank Bottom-up tank (with two rows of insulation remaining)
Top-down Natural to freeze from top, as in a lake Problem is to manage expansion in confined volume while removing gas from freezing front with active degassing Last (cloudy?) ice is at bottom, away from PMT Paul Evenson will show in detail how to do this Bottom-up Problem is to keep top from freezing when it’s cold outside Gas bubbles tend to rise so circulation alone removes gas as ice front advances Last (cloudy?) ice is at the top, near PMT Next 4 slides describe status of bottom-up Two methods
Depth profile of bottom-up tank Andrew McDermott measuring ice thickness in bottom-up tank --pump is on the right of the photo
3 piece cover of styrofoam insulation mounted below plywood backing Heater mounted under hat Top view of bottom-up tank showing cover and grid for depth measurements
Blue line connects measurements of average depth Red dashed lines: upper—depth near edge lower—depth near center Middle insulation band removed Feb 5 Feb 6 Jan 3 Jan 17 Dec 23 Feb 12 Ice-depth vs time for bottom-up tank Tank filled Nov 18
Photo on 5 Feb 2003 showing skim of ice after pump had been off for several hours
Signals of vertical and 45om • Trigger on SPASE scintillators, one above and one below the tank • Vertical muon deposits 200 MeV in 1 m water/ice • Compare runs taken just after filling with runs taken with half ice, half water • Compare with simulations
Muon signals • Four locations of muon telescope: Setting 1: diagonal trajectory deposits more energy Setting 2: some trajectories go through OM Setting 3: opposite pump Setting 4: near pump
Average wave forms in water-filled tank,4 telescope configurations
Bottom-up tank, diagonal configurationFeb 13 (bottom ice, top water)
Simulations • Based on GEANT4 • As used for Auger tanks • Modified for specifications of smaller tanks (2 m diameter, 1 m depth) with Tyvek lining by Ralf Ulrich and Todor Stanev • Tuning for ice and imperfections in progress • Need to determine and insert parameters for AMANDA PMTs we are using
Assumptions in simulationNote: except for tank size, these are Auger parametersNeed to use parameters for our PMTs • Tank geometry • Muon generates Cherenkov photons: GEANT4 • Tyvek reflectivity = specular (s > 0)+ Lambertian • PMT gain: 2 x 10⁵ • Impedance: 50 W • Quantum efficiency: ~0.16 • One PE pulse: Gaussian, s=2.55 ns, t½=8ns • One PE integrated charge: 1.6 x 10⁻¹⁰ C
Current status and plan • Both tanks somewhat over half frozen with a layer of imperfections • Try to finish freezing both tanks, including layer of imperfections • Final layer of ice may be cloudy • Take data triggering on muons with pair of SPASE scintillators • Compare signals in imperfect ice with simulations • Determine a minimum clarity/ice-quality requirement for tank detectors • Perform tests of stability of ice under mechanical and thermal stresses