Download
1 / 10
110 likes | 276 Views
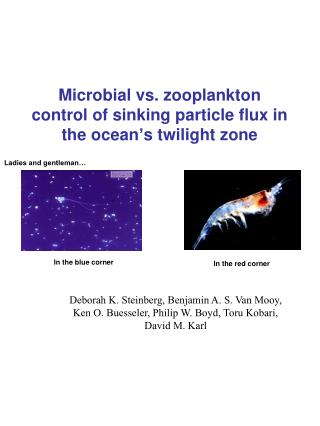
Microbial vs. zooplankton control of sinking particle flux in the ocean ’ s twilight zone. Ladies and gentleman…. Deborah K. Steinberg, Benjamin A. S. Van Mooy, Ken O. Buesseler, Philip W. Boyd, Toru Kobari, David M. Karl. In the blue corner. In the red corner. Conceptual diagram.

E N D
Microbial vs. zooplankton control of sinking particle flux in the ocean’s twilight zone Ladies and gentleman… Deborah K. Steinberg, Benjamin A. S. Van Mooy, Ken O. Buesseler, Philip W. Boyd, Toru Kobari, David M. Karl In the blue corner In the red corner
Conceptual diagram Supplementary figure 1.
Bacteria a. ALOHA b. K2 Supplementary figure 2.
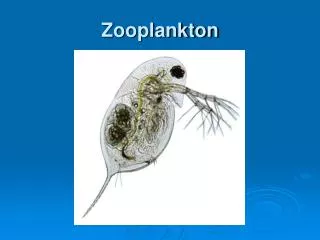
Zooplankton a. ALOHA Deployment 1 ALOHA Deployment 2 b. K2 Deployment 1 K2 Deployment 2 Supplementary figure 3.
Bacteria conversions What we measured: Bacteria production (BP) Bacterial respiration= (1-BGE)/ BGE*BP Bacterial C demand= BP/ BGE Thymidine conversion factor 1.0 - 2.0 x 10¹⁸ cells mole-1 Carbon conversion factor of 15 fg C cell-1 Bacteria Growth efficiency (BGE) 0.1 - 0.15 for open-ocean bacteria (Phil- ETS activity at ALOHA = 0.05 - 0.11) Sensitivity analysis Middle: 2.0 x 10¹⁸ cells mole & BGE of 0.15 Lower: 1.0 x 10¹⁸ cells mole& BGE of 0.15 Upper : 2.0 x 10¹⁸ cells mole& BGE of 0.1
Determine zooplankton biomass in depth zone Zooplankton conversions Zooplankton Respiration (ZR) CH20 + O2 CO2 + H20 ln (O2 consumption)= -0.399 + 0.801 ln (body weight) + 0.069 (temp) (Ikeda et al. 1985) Zooplankton C demand (ZCD) ZCD= ZR/ R * AE Sensitivity analysis: Middle: AE = 60% Lower: AE = 70% Upper : AE = 50%
Deployment 1 ALOHA Deployment 2 Figure 1.
Deployment 1 K2 Deployment 2 Figure 2.