Download
1 / 1
10 likes | 84 Views
Explore discriminant fragments of cytochrome c oxidase in Hexapoda orders using VB.Net program for visual comparison and sequence matching. Discover the importance of coordinated data collection for molecular systematics.

E N D
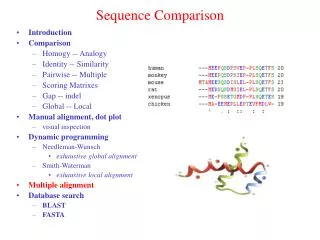
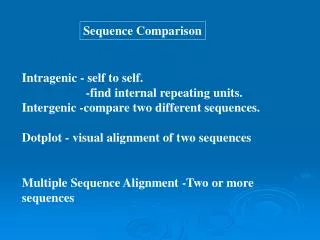
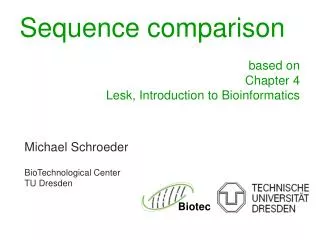
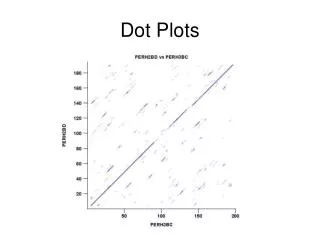
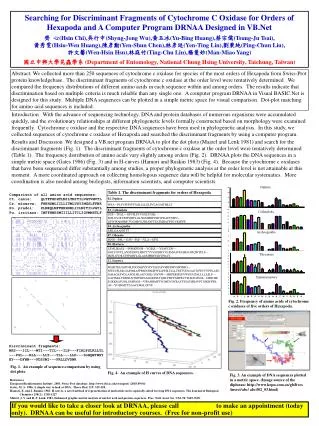
Abstract: We collected more than 250 sequences of cytochrome c oxidase for species of the most orders of Hexapoda from Swiss-Prot protein knowledgebase. The discriminant fragments of cytochrome c oxidase at the order level were tentatively determined. We compared the frequency distributions of different amino acids in each sequence within and among orders. The results indicate that discrimination based on multiple criteria is much reliable than any single one. A computer program DRNAA in Visual BASIC.Net is designed for this study. Multiple DNA sequences can be plotted in a simple metric space for visual comparison. Dot-plot matching for amino acid sequences is included. Searching for Discriminant Fragments of Cytochrome C Oxidase for Orders of Hexapoda and A Computer Program DRNAA Designed in VB.Net齊 心(Hsin Chi),吳行中(Shyng-Jong Wu),黃玉冰(Yu-Bing Huang),蔡宗儒(Tsung-Ju Tsai),黃秀雯(Hsiu-Wen Huang),陳彥勳(Yen-Shun Chen),林彥廷(Yen-Ting Lin),劉秉純(Ping-Chun Liu),許文馨(Wen-Hsin Hsu),林庭竹(Ting-Chu Lin),楊曼妙(Man-Miao Yang)國立中興大學昆蟲學系(Department of Entomology, National Chung Hsing University, Taichung, Taiwan) Introduction With the advance of sequencing technology, DNA and protein databases of numerous organisms were accumulated quickly, and the evolutionary relationships at different phylogenetic levels formally constructed based on morphology were examined frequently. Cytochrome c oxidase and the respective DNA sequences have been used in phylogenetic analysis. In this study, we collected sequences of cytochrome c oxidase of Hexapoda and searched the discriminant fragments by using a computer program. Results and Discussion We designed a VB.net program DRNAA to plot the dot plots (Maizel and Lenk 1981) and search for the discriminant fragments (Fig. 1). The discriminant fragments of cytochrome c oxidase at the order level were tentatively determined (Table 1). The frequency distribution of amino acids vary slightly among orders (Fig. 2). DRNAA plots the DNA sequences in a simple metric space (Gates 1986) (Fig. 3) and in H-curves (Hamori and Ruskin 1983) (Fig. 4). Because the cytochrome c oxidases that have been sequenced differ substantially among studies, a proper phylogenetic analysis at the order level is not attainable at this moment. A more coordinated approach on collecting homologous sequence data will be helpful for molecular systematics. More coordination is also needed among biologists, information scientists, and computer scientists. Comparison of all amino acid sequences: Ct. canis: QLTFFHDHTLMILTMITILVGYVMVTL Cr. minerva: FHNHSMLIILLITMLVSYIMGSLFFNK Po. pradoi: PLMEQLMFFHNHSMLIILMITILVGYL Pu. irritans: INFFHNHSMIIILLITILIGYMMSTLF Fig. 2. Frequency of amino acids of cytochrome c oxidases of five orders of Hexapoda. Discriminant fragments: NHS---IIL---WTI---TIL---ILP---FIALPSLRLLYL ---PSL---RLL---LLY---YLL---LLD---IGHQWYWSY EY---DFNN---FDSYMI---FRLLDVDNR Fig. 1. An example of sequence-comparison by using dot plots. Fig. 4. An example of H curves of DNA sequences. Fig. 3. An example of DNA sequences plotted in a metric space. (Image source of the dipluran: http://www.kepu.com.cn/gb/lives /insect/abc/ abc402_03.html) References European Bioinformatics Intitute. 2003. Swiss-Prot database. http://www.ebi.ac.uk/swissprot/ (2003.09.04) Gates, M. A. 1986. A simple way to look at DNA. Theor. Biol. 119: 319-328. Hamori, E. and J. Ruskin. 1983. H curves, a novel method of representation of nucleotide series especially suited for long DNA sequences. The Journal of Biological Chemistry 258(2): 1318-1327. Maizel, J. V. and R. P. Lenk. 1981. Enhanced graphic matrix analysis of nucleic acid and protein sequences. Proc. Natl. Acad. Sci. USA 78: 7665-7669. If you would like to take a closer look at DRNAA, please call 0932633124 to make an appointment (today only). DRNAA can be useful for introductory courses. (Free for non-profit use)