Understanding Bayesian Networks: Causal Reasoning in Student Performance and Grades
This document explores the application of Bayesian networks in modeling the relationships between student intelligence, grades, SAT performance, and perceived difficulty of classes. Through evidential reasoning and intercausal analysis, it demonstrates how these factors interplay to affect a student's academic outcomes. Key probabilistic concepts are illustrated, revealing insights into how letter grades and test performance influence perceptions of class difficulty and intelligence. The findings emphasize the complexity of student performance and its implications for educational assessment.

Understanding Bayesian Networks: Causal Reasoning in Student Performance and Grades
E N D
Presentation Transcript
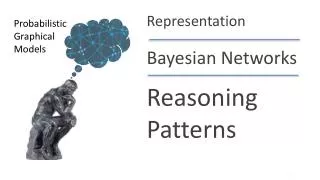
Representation Probabilistic Graphical Models Bayesian Networks Reasoning Patterns
d0 d1 i0 i1 0.6 0.4 0.7 0.3 g1 g2 g3 i0,d0 0.3 0.4 0.3 i0,d1 0.05 0.25 0.7 s0 s1 i1,d0 0.9 0.08 0.02 i0 0.95 0.05 i1,d1 0.5 0.3 0.2 i1 0.2 0.8 l0 l1 g1 0.1 0.9 g2 0.4 0.6 g3 0.99 0.01 The Student Network Difficulty Intelligence Grade SAT Letter
Causal Reasoning Intelligence Intelligence Difficulty Difficulty Grade SAT P(l1) ≈ 0.5 Letter P(l1 | i0) ≈ 0.39 P(l1 | i0 , d0) ≈ 0.51
g1 g2 g3 i0,d0 0.3 0.4 0.3 i0,d1 0.05 0.25 0.7 i1,d0 0.9 0.08 0.02 i1,d1 0.5 0.3 0.2 Evidential Reasoning P(d1) = 0.4 P(i1) = 0.3 P(d1 | g3) ≈ P(i1 | g3) ≈ 0.63 0.08 Difficulty Intelligence Student gets a C Grade SAT Letter
Intercausal Reasoning P(d1) = 0.4 P(i1) = 0.3 P(d1 | g3) ≈ 0.63 P(i1 | g3) ≈ 0.08 P(i1 | g3, d1) ≈ 0.11 Difficulty Intelligence Class is hard! Grade SAT Student gets a C Letter
Intercausal Reasoning Explained X1 X2 Y OR
Intercausal Reasoning II P(i1) = 0.3 P(i1 | g2) ≈ 0.175 P(i1 | g2, d1) ≈ 0.34 Difficulty Difficulty Intelligence Class is hard! Grade SAT g2 Student gets a B Letter
Student Aces the SAT • What happens to the posterior probability that the class is hard? Difficulty Intelligence Grade SAT Student aces the SAT Letter Student gets a C
Student Aces the SAT P(d1) = 0.4 P(i1) = 0.3 P(d1 | g3) ≈ 0.63 P(i1 | g3) ≈ 0.08 P(d1 | g3, s1) ≈ 0.76 P(i1 | g3, s1) ≈ 0.58 Difficulty Intelligence Grade SAT Student aces the SAT Letter Student gets a C