Download
1 / 32
420 likes | 592 Views
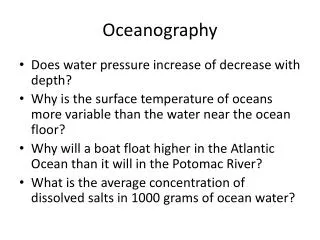
Learn about satellite oceanography, its applications in monitoring sea surface temperatures, air-sea interactions, sea ice patterns, and more. Understand the technology behind getting satellites into orbit and measuring data from space. Discover how satellite observations aid in studying phenomena like El Nino and biological productivity. Explore the role of polar and geostationary orbits in gathering valuable ocean data. Dive into the significance of sea surface temperature anomalies, ocean color for biological productivity assessment, and sea surface topography variations.

E N D
Satellite Oceanography Presented at STAO 2003 Dr. Michael J. Passow White Plains Middle School, White Plains, NY, Science Teachers Association of New York State (STANYS), and Amer. Meteorological Society Education Resource Agent
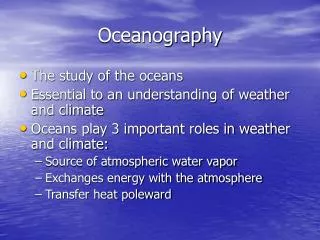
Ocean Satellites • Permit observations globally, especially useful where no ships or buoys • Developed later than meteorological and other environmental sensing because electromagnetic radiation penetrates ocean water only to limited depths • Improved sensors permit inferences about ocean at greater depths
"Satellite Oceanography" • Sensors aboard satellites provide global views and allow temporal (time) studies not possible from surface vessels. • Surface topography, El Nino, and ocean winds are some of the areas being investi-gated from space. http://winds.jpl.nasa.gov/
Satellite Oceanography Applications • Sea surface temperatures • Air-sea interactions • Sea Ice patterns • Monitoring ocean waves • Determining sea level variations • Analysis of ocean currents and eddies • Biological productivity • Precipitation patterns
Problem 1—How do you get a satellite into orbit? • Basically, a rocket is a chamber with an opening containing gas under pressure. A balloon can serve as a simple model. • As the gas escapes, its thrust in one direction propels the rocket in the opposite direction. http://quest.arc.nasa.gov/space/teachers/rockets/principles.html
What keeps an object in orbit? • Satellites can only stay in orbit when the gravitational pull exactly balances the forward motion (inertia). • These ideas were first explained by Newton in the 1680s! http://quest.arc.nasa.gov/space/teachers/rockets/principles.html
“Polar Orbiting” (POES) Takes about 90 minutes to make one revolution Covers different areas each orbit as Earth rotates Provides detailed images Can produce time sequence Geostationary (Geosynchronous) (GOES) Remains over same portion of planet by revolving with same period as Earth’s rotation Can provide full disk or smaller views Useful for weather and communication Two basic satellite orbits
http://www.iitap.iastate.edu/gcp/satellite/images/image7.gif
For more detailed studies, we use “polar-orbiting” satellites • Polar-orbiting satellites are much closer to the surface (700 – 800 km) and make about 14 passes each day. They can provide good time sequence studies. http://www.earth.nasa.gov/history/landsat/landsat4.html
Problem 2—How do you measure from a satellite? • Satellites can detect what’s on Earth in two ways: • “passive” observation of energy reflected or radiated from the surface • “active” collection of signals beamed down from the satellite and reflected back http://topex-www.jpl.nasa.gov/
Sea surface temperatures (SST) and thermal properties • Visible satellites can monitor difference between incoming solar radiation and reflected light • Infrared satellites can monitor IR energy emitted from surfaces • AVHRR (Advanced Very High Resolution Radiometer) measure SSTs • Also monitored with MODIS (Moderate Resolution Imaging Spectroradiometer)
SST Images[link through DStreme Ocean] http://www.cdc.noaa.gov/map/images/sst/sst.gif
Sea Surface Temperature Anomalies (SSTA) • Images constructed by measuring difference between “observed” and “expected” values – anomalies • Better approach to recognizing “what is unusual,” not just “what is” • Especially useful for El Nino/La Nina studies—example: http://orbit-net.nesdis.noaa.gov/orad/sub/sst_anomaly_2m.html
SSTA images http://www.osdpd.noaa.gov/PSB/EPS/SST/climo.html
Ocean Color – Biological Productivity http://seawifs.gsfc.nasa.gov/cgi/seawifs_browse.pl http://seawifs.gsfc.nasa.gov/cgi/seawifs_browse.pl Sea-viewing Wide Field-of-View Sensor (SeaWIFS) and MODIS have measured chlorophyll in phytoplankton to enable useful inferences about productivity
SeaWIFS has allowed us to monitor the links between physical and chemical conditions and marine biology • Short-term spatial and temporal variabilities • Biological response to climate changes http://seawifs.gsfc.nasa.gov/SEAWIFS.html
Sea Surface Topography • Variations in sea surface heights caused by gravity variations (sea floor topography and geology) • Also seasonal changes in atmospheric and ocean circulation patterns • Radar altimeters aboard TOPEX/Poseidon and Jason satellites • AMS “Measuring Sea Level from Space”
TOPEX-Poseidon is… • a partnership between the U.S. and France to monitor global ocean circulation, discover the tie between the oceans and atmosphere, and improve global climate predictions. Every 10 days, the TOPEX/Poseidon satellite measures global sea level with unparalleled accuracy. http://topex-www.jpl.nasa.gov/mission/mission.html
TOPEX has been especially useful in understanding… • Variations in sea surface temperatures. This has been the most important instrument for observing El Nino/ La Nina changes in the Pacific Ocean, and all the effects on climate http://topex-www.jpl.nasa.gov/elnino/elnino.html
Jason 1 is a follow-on mission to TOPEX- Poseidon Monitors global ocean circulation, studies ties between the oceans and atmosphere, improves global climate forecasts and predictions, and monitors events such as El Niño conditions and ocean eddies. http://www.jpl.nasa.gov/missions/current/jason1.html
Sea Ice Extent • Areal extent, amount, and thickness important for oceanographers and operationally • Visible images not feasible during winter • POES microwave sensors provide operational ice analyses • The next slide shows an example of sea ice cover in the Northern Hemisphere
Precipitation Patterns • Preponderance of precipitation falls in tropical regions • Previously difficult to measure because few observation stations • TRMM (Tropical Rainfall Measuring Mission) began as experimental, now operational
TRMM Precipitation Patterns This shows average rainfall in the Tropics last month. Monthly records go back to 1998. http://trmm.gsfc.nasa.gov/
Precipitation Anomaly Patterns Anomaly images show regions of that are unusually higher or lower than normal. http://trmm.gsfc.nasa.gov/images/3B43_anom_oct03.gif
Hurricane and Lightning Images TRMM images have permitted amazing new views of storms and related weather in the Tropics. http://trmm.gsfc.nasa.gov/images_dir/images.html
Activities Based on TRMM Data • Institute for Global Environmental Studies (IGES) http://www.strategies.org/TRMM.html Classroom-oriented activities based on TRMM concerning ENERGY, CLOUDS, WIND, PRECIPITATION, AND WEATHER
Canadian Satellite Imagery Meteorological Service of Canada (Service météorologique du Canada) provides many satellite images at http://www.weatheroffice.ec.gc.ca/satellite/index_e.html These utilize NOAA GOES and POES images.
http://www.weatheroffice.ec.gc.ca/satellite/index_e.html#hrpthttp://www.weatheroffice.ec.gc.ca/satellite/index_e.html#hrpt
Canadian Sea Ice Imagery Ice conditions monitored by satellite and ships are available at http://ice-glaces.ec.gc.ca/App/WsvPageDsp.cfm?ID=1&Lang=eng
Examples of Teacher-Training and Classroom-Ready Activities • AMS “Measuring Sea Level from Space” • DataStreme Ocean investigations – modified from the Fall 2003 pilot testing
This slide show is available in the “Resources” Section of “Earth2Class” michael@earth2class.org