Satellite Oceanography
290 likes | 584 Views
Satellite Oceanography. Modified from a Presentation at STAO 2003 By Dr. Michael J. Passow. Ocean Satellites. Permit observations globally, especially useful where there are no ships or buoys

Satellite Oceanography
E N D
Presentation Transcript
Satellite Oceanography Modified from a Presentation at STAO 2003 By Dr. Michael J. Passow
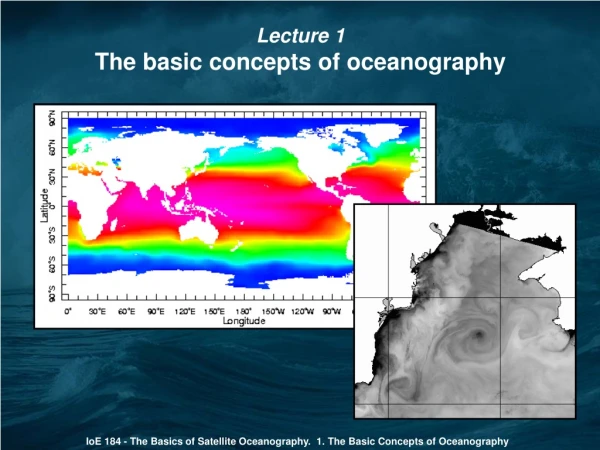
Ocean Satellites • Permit observations globally, especially useful where there are no ships or buoys • Developed later than meteorological and other environmental sensing because electromagnetic radiation penetrates ocean water only to limited depths • Improved sensors permit inferences about ocean at greater depths
"Satellite Oceanography" • Surface topography, El Nino, and ocean winds are some of the areas investigated from space. http://winds.jpl.nasa.gov/
Satellite Oceanography Applications • Sea surface temperatures • Air-sea interactions • Sea Ice patterns • Monitoring ocean waves • Determining sea level variations • Analysis of ocean currents and eddies • Biological productivity • Precipitation patterns
“Polar Orbiting” (POES) Takes about 90 minutes to make one revolution Covers different areas each orbit as Earth rotates Provides detailed images Can produce time sequence Geostationary (Geosynchronous) (GOES) Remains over same portion of planet by revolving with same period as Earth’s rotation Can provide full disk or smaller views Useful for weather and communication Two basic satellite orbits
http://www.iitap.iastate.edu/gcp/satellite/images/image7.gif
For more detailed studies, we use “polar-orbiting” satellites • Polar-orbiting satellites are much closer to the surface (700 – 800 km) and make about 14 passes each day. They can provide good time sequence studies. http://www.earth.nasa.gov/history/landsat/landsat4.html
Problem 2—How do you measure from a satellite? • Satellites can detect what’s on Earth in two ways: • “passive” observation of energy reflected or radiated from the surface • “active” collection of signals beamed down from the satellite and reflected back http://topex-www.jpl.nasa.gov/
Sea surface temperatures (SST) and thermal properties • Visible satellites can monitor difference between incoming solar radiation and reflected light • Infrared satellites can monitor IR energy emitted from surfaces • AVHRR (Advanced Very High Resolution Radiometer) measure SSTs • Also monitored with MODIS (Moderate Resolution Imaging Spectroradiometer)
SST Images[link through DStreme Ocean] http://www.cdc.noaa.gov/map/images/sst/sst.gif
Sea Surface Temperature Anomalies (SSTA) • Images constructed by measuring difference between “observed” and “expected” values – anomalies • Better approach to recognizing “what is unusual,” not just “what is” • Especially useful for El Nino/La Nina studies—example: http://orbit-net.nesdis.noaa.gov/orad/sub/sst_anomaly_2m.html
SSTA images http://www.osdpd.noaa.gov/PSB/EPS/SST/climo.html
SeaWIFS has allowed us to monitor the links between physical and chemical conditions and marine biology • Biological response to climate changes http://seawifs.gsfc.nasa.gov/SEAWIFS.html
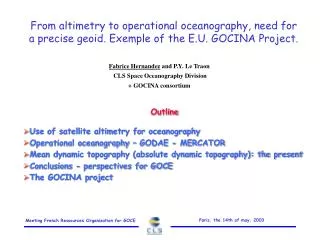
Sea Surface Topography • Variations in sea surface heights caused by gravity variations (sea floor topography and geology) • Also seasonal changes in atmospheric and ocean circulation patterns • Radar altimeters aboard TOPEX/Poseidon and Jason satellites • AMS “Measuring Sea Level from Space”
TOPEX-Poseidon is… • a partnership between the U.S. and France to monitor global ocean circulation, discover the tie between the oceans and atmosphere, and improve global climate predictions. Every 10 days, the TOPEX/Poseidon satellite measures global sea level with unparalleled accuracy. http://topex-www.jpl.nasa.gov/mission/mission.html
TOPEX has been especially useful in understanding… • Variations in sea surface temperatures. This has been the most important instrument for observing El Nino/ La Nina changes in the Pacific Ocean, and all the effects on climate http://topex-www.jpl.nasa.gov/elnino/elnino.html
Jason 1 is a follow-on mission to TOPEX- Poseidon Monitors global ocean circulation, studies ties between the oceans and atmosphere, improves global climate forecasts and predictions, and monitors events such as El Niño conditions and ocean eddies. http://www.jpl.nasa.gov/missions/current/jason1.html
Sea Ice Extent • Areal extent, amount, and thickness important for oceanographers and operationally • Visible images not feasible during winter • POES microwave sensors provide operational ice analyses • The next slide shows an example of sea ice cover in the Northern Hemisphere
Canadian Sea Ice Imagery Ice conditions monitored by satellite and ships are available at http://ice-glaces.ec.gc.ca/App/WsvPageDsp.cfm?ID=1&Lang=eng