Download
1 / 33
330 likes | 675 Views
Revisiting the Operating Expense Database & Drilling Down Into NPI Acquisitions. Walter G. Page Director of Market Research and Portfolio Strategy. October 2008. 6/9/2014. Updated 4/4. Revisiting The Operating Expense Study. Entire NCREIF Universe = 4,878 properties

E N D
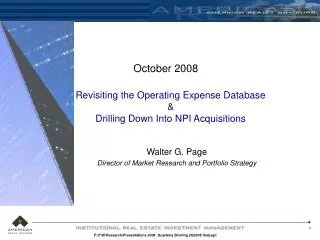
Revisiting the Operating Expense Database&Drilling Down Into NPI Acquisitions Walter G. Page Director of Market Research and Portfolio Strategy October 2008 6/9/2014
Updated 4/4 Revisiting The Operating Expense Study • Entire NCREIF Universe = 4,878 properties • Excluded properties acquired after the 4th quarter of 2002 • Excluded properties for which were not in NCREIF’s database prior to 2004 • Excluded properties that were not in NCREIF’s database in the second quarter of 2008. • Same Store Universe = 1,202 properties • Office = 338 properties • Industrial = 532 properties • Multifamily = 210 properties • Retail = 122 properties Source: ARA Research 1 6/9/2014
Updated 7/30/2008 Market Coverage of Operating Database – Office Sector Source: NCREIF, Torto Wheaton, ARA Research
Updated 7/30/2008 Market Coverage of Operating Database – Industrial Sector Source: NCREIF, Torto Wheaton, ARA Research
Updated 7/30/2008 Market Coverage of Operating Database – Multifamily Sector Source: NCREIF, Torto Wheaton, ARA Research
Updated 7/30/2008 Market Coverage of Operating Database – Retail Sector Source: NCREIF, PPR, ARA Research
Updated 7/28/08 Operating Expenses on the Rise Annual Operating Expenses PSF % 2004 to 2007 Change 10.5% 11.4% 8.9% 16.7% Source: NCREIF, ARA Research 6/9/2014
Updated 7/28/08 Operating Expenses on the Rise Annual Operating Expenses Per SF % Change 2006 to 2007 4.2% 2.5% 6.3% 8.2% Source: NCREIF, ARA Research 6/9/2014
Updated 7/29 Office: Segmentation of Operating Expenses Insurance 4% $0.58 PSF Marketing 1% $0.09 PSF Management Fee 5% $0.63 PSF Average Building Operating Expenses $13.15 PSF Administrative 8% $1.06 PSF Real Estate Taxes 29% $3.79 PSF Other Expenses 12% $1.64 PSF Maintenance 23% $3.04 PSF Utilities 18% $2.32 PSF Note: Expense segmentation represents OPEX for 2007 on a same store basis. Excludes buildings acquired since 2003 Source: NCREIF, ARA Research
% Change 12% 21% 4% 6% 31% 4% 6% 4% 8% Updated 7/28/08 Office Expenses by Category Annual Operating Expenses Per SF Source: NCREIF, ARA Research 6/9/2014
Updated 7/29 Industrial: Segmentation of Operating Expenses Administrative 4% $0.07 PSF Marketing 0% $0.01 PSF Utilities 6% $0.10 PSF Average Building Operating Expenses $1.69 PSF Other Expenses 7% $0.12 PSF Management Fee 8% $0.13 PSF Real Estate Taxes 46% $0.78 PSF Insurance 9% $0.15 PSF Maintenance 20% $0.33 PSF Note: Expense segmentation represents OPEX for 2007 on a same store basis. Excludes buildings acquired since 2003 Source: NCREIF, ARA Research
% Change 22% -1% 3% 19% 3% 29% 8% 2% 6% Updated 7/28/08 Industrial Expenses by Category $ Per Occupied SF Source: NCREIF, ARA Research 6/9/2014
Updated 7/29 Multifamily: Segmentation of Operating Expenses Insurance 6% $0.34 PSF Marketing 6% $0.39 PSF Average Building Operating Expenses $6.14 PSF Management Fee 7% $0.46 PSF Real Estate Taxes 27% $1.64 PSF Other Expenses 9% $0.58 PSF Utilities 11% $0.69 PSF Maintenance 18% $1.08 PSF Administrative 16% $0.96 PSF Note: Expense segmentation represents OPEX for 2007 on a same store basis. Excludes buildings acquired since 2003 Source: NCREIF, ARA Research
% Change 10% 3% 5% -12% 4% 4% 4% 3% 2% Updated 7/28/08 Multifamily Expenses by Category $ Per Occupied SF Source: NCREIF, ARA Research 6/9/2014
Updated 7/29 Retail: Segmentation of Operating Expenses Marketing 5% $0.44 PSF Insurance 4% $0.37 PSF Average Building Operating Expenses $9.55 PSF Administrative 7% $0.71 PSF Management Fee 8% $0.77 PSF Real Estate Taxes 31% $2.94 PSF Utilities 9% $0.86 PSF Other Expenses 12% $1.20 PSF Maintenance 24% $2.26 PSF Note: Expense segmentation represents OPEX for 2007 on a same store basis. Excludes buildings acquired since 2003 Source: NCREIF, ARA Research
% Change 8% -1% 15% 2% 9% -2% 2% 6% 4% Updated 7/28/08 Retail Expenses by Category $ Per Occupied SF Source: NCREIF, ARA Research 6/9/2014
% Change 2004 to 2007 50.7% 68.6% -10.0% 20.7% Updated 7/28/08 CapEx Rising Rapidly For Consumer-Driven Real Estate Annual Capital Expenditures PSF Source: NCREIF, ARA Research 6/9/2014
Updated 7/30/08 CapEx Breakdown - Office Annual Capital Expenditures PSF Source: NCREIF, ARA Research 6/9/2014
Updated 7/30/08 CapEx Breakdown - Industrial Annual Capital Expenditures PSF Source: NCREIF, ARA Research 6/9/2014
Updated 7/30/08 CapEx Breakdown - Multifamily Annual Capital Expenditures PSF Source: NCREIF, ARA Research 6/9/2014
Updated 7/30/08 CapEx Breakdown – Retail Annual Capital Expenditures PSF Source: NCREIF, ARA Research 6/9/2014
Cumulative% Change (’04-’07) 17.4% 18.7% 6.3% 10.4% Updated 7/30/08 NOI Growth Strongest For Consumer-Driven Sectors Annual Net Operating Income PSF Source: NCREIF, ARA Research 6/9/2014
Cumulative% Change (’04-’07) 13.0% 13.7% 3.6% 13.1% Updated 7/30/08 Base Rent is Steadily Rising—Except for Industrial Base Rent PSF Source: NCREIF, ARA Research 6/9/2014
Cumulative% Change (’04-’07) 11.7% 21.0% 10.3% 10.4% Updated 7/30/08 Income Breakdown - Office $ PSF Source: NCREIF, ARA Research 6/9/2014
Cumulative% Change (’04-’07) 3.7% 22.3% 1.5% 6.3% Updated 7/30/08 Income Breakdown - Industrial $ PSF Source: NCREIF, ARA Research 6/9/2014
Cumulative% Change (’04-’07) 13.7% 39.4% 42.7% 18.6% Updated 7/30/08 Income Breakdown - Multifamily $ PSF Source: NCREIF, ARA Research 6/9/2014
Cumulative% Change (’04-’07) 13.0% 17.2% 26.7% 17.4% Updated 7/30/08 Income Breakdown - Retail $ PSF Source: NCREIF, ARA Research 6/9/2014
Updated 4/4 Drilling Down into NPI by Year of Acquisition • What is Known About NPI • Appraisal Lag Of About 6 to 8 Quarters • NPI Transaction Cap Rate is An Early Indicator of Value • Open Ended Fund Index Adjusts Faster than the Overall Index • What is Known About Acquisitions • Are Valued in Today’s Market • Most of the Return is From Income Source: ARA Research 27 6/9/2014
Updated 7/22/08 Looking At Past Periods of Market Stress Cumulative 3 Year Total Return • In each case total returns on new investments outpaced that of existing investments, to average nearly 18% more than the market average over the next three years Year Source: NCREIF, ARA Research
Updated 7/22/08 Why Invest Now? • During past downturns, new acquisition performance has usually outperformed the overall market Percent Annual Total Return Forecast Returns Favor New Acquisitions Source: NCREIF, ARA Research
Why New Acquisitions Should Exceed NPI In Today’s MarketTransaction Cap Rates Have Moved Up but Appraised Cap Rates Have Lagged Greatest Difference in Cap Rates Since 1990’s Trailing NCREIF Cap Rate Long Term Average 8.6% 8.2% Source: NCREIF, ARA Research
Cap Rates Relative to Alternative Investments Transaction Cap Rates Are Now at Long-Term Spread to 10 Year T Bill % Difference in Cap Rate to 10 Yr T Bill Long Term Average 2.7% 2.3% Source: NCREIF, ARA Research
Revisiting the Operating Expense Database&Drilling Down Into NPI Acquisitions Walter G. Page Director of Market Research and Portfolio Strategy October 2008 6/9/2014