Geometric Interpretation of Random Sampling and Variance in Multivariate Data
Understanding the geometric aspects of random sampling, joint distributions, and variance in multivariate datasets. Explore proofs, examples, and interpretations to enhance statistical analysis.

Geometric Interpretation of Random Sampling and Variance in Multivariate Data
E N D
Presentation Transcript
Sample Geometry and Random Sampling Shyh-Kang Jeng Department of Electrical Engineering/ Graduate Institute of Communication/ Graduate Institute of Networking and Multimedia
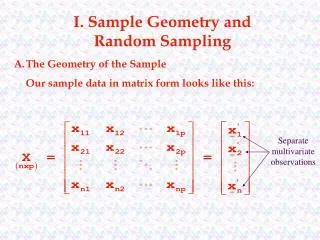
Array of Data *a sample of size n from a p-variate population
Random Sample • Row vectors X1’, X2’, …, Xn’ represent independent observations from a common joint distribution with density function f(x)=f(x1, x2, …, xp) • Mathematically, the joint density function of X1’, X2’, …, Xn’ is
Random Sample • Measurements of a single trial, such as Xj’=[Xj1,Xj2,…,Xjp], will usually be correlated • The measurements from different trials must be independent • The independence of measurements from trial to trial may not hold when the variables are likely to drift over time
Geometric Interpretation of Randomness • Column vector Yk’=[X1k,X2k,…,Xnk] regarded as a point in n dimensions • The location is determined by the joint probability distribution f(yk) = f(x1k, x2k,…,xnk) • For a random sample, f(yk)=fk(x1k)fk(x2k)…fk(xnk) • Each coordinate xjk contributes equally to the location through the same marginal distribution fk(xjk)
Interpretation in p-space Scatter Plot • Equation for points within a constant distance c from the sample mean
Result 3.2 • The generalized variance is zero when the columns of the following matrix are linear dependent
Examples Cause Zero Generalized Variance • Example 1 • Data are test scores • Included variables that are sum of others • e.g., algebra score and geometry score were combined to total math score • e.g., class midterm and final exam scores summed to give total points • Example 2 • Total weight of chemicals was included along with that of each component
Result 3.3 • If the sample size is less than or equal to the number of variables ( ) then |S| = 0 for all samples
Result 3.4 • Let the p by 1 vectors x1, x2, …, xn, where xj’ is the jth row of the data matrix X, be realizations of the independent random vectors X1, X2, …, Xn. • If the linear combination a’Xj has positive variance for each non-zero constant vector a, then, provided that p < n, S has full rank with probability 1 and |S| > 0 • If, with probability 1, a’Xj is a constant c for all j, then |S| = 0
Volume Generated by Deviation Vectors of Standardized Variables