Download
1 / 6
60 likes | 132 Views
This study provides an overview of DNase hypersensitivity on chromosome 5 in male and female mouse samples, comparing sequences across control and DNase-treated samples. The data show fine structures of DNase hypersensitive sites and transcription factor binding predictions within specific regions. The peak-Seq analysis reveals overlaps between male, female, male-specific, and female-specific DHS sites. Linearity of male and female reads in non-sex-specific peak regions is explored, highlighting the effects of square root transformation. Locations of DHS sites relative to known transcripts are also discussed, shedding light on sex-specific and sex-independent distributions. Co-occurrence of eight male-specific, GH-enriched motifs is analyzed in DHS sites.

E N D
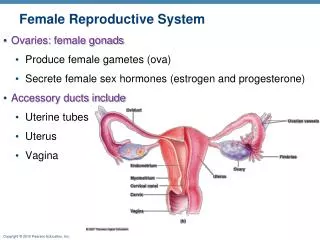
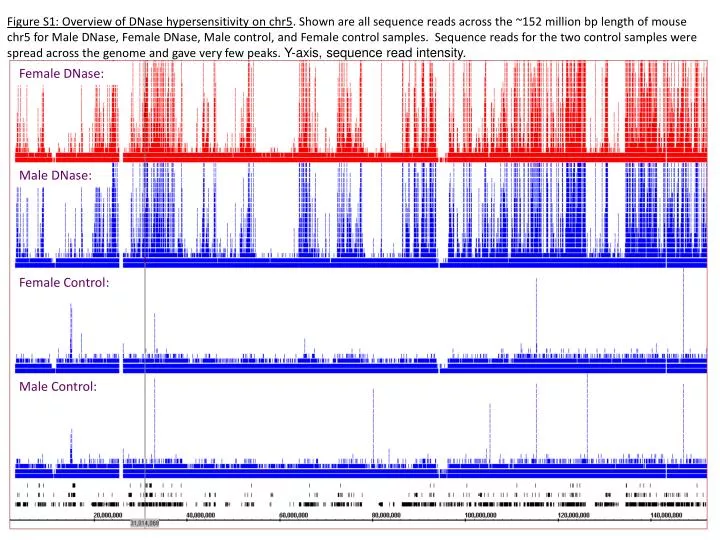
Female DNase: Male DNase: Female Control: Male Control: Figure S1: Overview of DNase hypersensitivity on chr5. Shown are all sequence reads across the ~152 million bp length of mouse chr5 for Male DNase, Female DNase, Male control, and Female control samples. Sequence reads for the two control samples were spread across the genome and gave very few peaks. Y-axis, sequence read intensity.
AAAGTTCA Alb promoter sequence HNF4 motif Fig. S1B. Fine structure of Alb upstream DNase HS site at -13.7 kb . Display shows an apparent digital ‘footprint’, i.e., segments within a DHS site that are depleted of fragments, where TFs may be bound. Shown at top are predicted transcription factor binding site within the -13.7 kb DHS site. Blue, green: (+) strand read; Yellow, red: (-) strand read
Female vs Control DHS sites Male vs Control DHS sites 45,214 45,955 Male-specific DHS sites Female-specific DHS sites Replicate 1 (n = 50,606) Replicate 2 (n = 73,973) Replicate 1 (n = 53,453) Replicate 2 (n = 63,457) Replicate 1 (n = 690) Replicate 2 (n = 810) 850 434 Replicate 1 (n = 1,218) Replicate 2 (n = 1,947) Fig. S2 Figure S2: Peak-Seq analysis: Overlap between biological replicates for male, female, male-specific and female-specific DHS sites. Sites with p-value < 0.01 and fold difference > 2, identified by PeakSeq, are shown.
Scatter plot Residuals vs. Fitted Normal quantile-quantile plot Standardized residuals # Male reads Residuals Theoretical quantiles # Female reads Fitted values Fig. S3 A. Scatter plot Residuals vs. Fitted Normal quantile-quantile plot Standardized residuals # Male reads Residuals Theoretical quantiles # Female reads Fitted values B. Figure S3: Linearity of Male reads vs Female reads in non sex-specific peak regions on chromosome 1, before and after square root transformation. Shown are scatter plots, residual plots, and quantile-quantile plots before (A) and after (B) square root transformation of both variables. Square root transformation improves linearity.
A. B. Fig. S5 Figure S5: Locations of DHS sites relative to known transcripts. Genomic locations of high stringency sex-independent (A) and sex-specific (B) DHS sites were compared to all known transcripts (known genes, mRNAs, and ESTs) from the UCSC genome database. A greater fraction of sex-specific DHS are intergenic (35%) when compared to sex-independent DHS sites. Promoters are defined as within 5 kb of a TSS; intergenic regions are those outside of promoter or coding regions.
Figure S7: Co-occurrence of the eight M-GH-enriched motifs. Shown are the proportions of male-specific, GH-responsive DHS sites ("M-GH") and of sex-independent DHS sites, that contain 0 (white) to 8 (black) of the 8 motifs that were discovered to be enriched in M-GH-responsive sites and depleted in female-specific, GH-responsive sites. (A) Distribution based on all instances of matches to the 8 motifs. (B) Distribution based on all instances in which motif matches do not overlap; motifs matches were considered to overlap if they overlap by at least 1 nt, after trimming motif edges with information content < 0.5. A B