Download
1 / 8
80 likes | 170 Views
Learn about the Arctic Oscillation, its positive and negative phases, and how it influences weather patterns in different regions. Explore the trends in AO and its correlation with temperature anomalies and snowfall. Discover how the AO affects conditions in the United States and Eurasia.

E N D
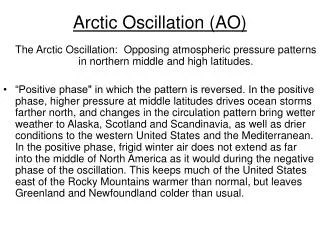
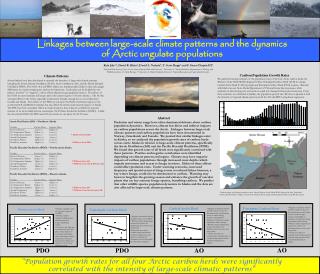
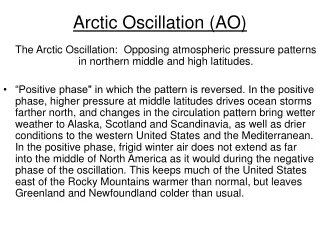
Arctic Oscillation (AO) The Arctic Oscillation: Opposing atmospheric pressure patterns in northern middle and high latitudes. • “Positive phase" in which the pattern is reversed. In the positive phase, higher pressure at middle latitudes drives ocean storms farther north, and changes in the circulation pattern bring wetter weather to Alaska, Scotland and Scandinavia, as well as drier conditions to the western United States and the Mediterranean. In the positive phase, frigid winter air does not extend as far into the middle of North America as it would during the negative phase of the oscillation. This keeps much of the United States east of the Rocky Mountains warmer than normal, but leaves Greenland and Newfoundland colder than usual.
Arctic Oscillation (AO) • “Negative phase“ = relatively high pressure over the polar region and low pressure at middle latitudes (about 45 degrees North). Weather patterns in the negative phase are in general "opposite" to those of the positive phase, as illustrated below. (Important point = negative AO more likely to feature below normal temperatures in the eastern U.S. when compared to a positive AO.) • Over most of the past century, the Arctic Oscillation alternated between its positive and negative phases. Starting in the 1970s, however, the oscillation has tended to stay in the positive phase, causing lower than normal arctic air pressure and higher than normal temperatures in much of the United States and northern Eurasia.
Arctic Oscillation (AO) Positive Arctic Oscillation (+AO) Negative Arctic Oscillation (-AO)
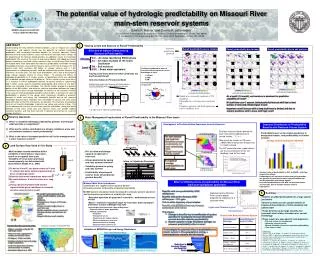
AO in December and Trend in the Following January (Don S in Dec 2006) There is a strong tendency for the Arctic Oscillation to remain predominantly positive in January following a highly positive figure in December. Through today, the Arctic Oscillation is averaging +2.360. If that average were to be maintained, it would be the highest December figure on record.The 10 highest figures on record are:1951 1.9871988 1.6791992 1.6271991 1.6131998 1.3531979 1.2951975 1.2901990 1.2771972 1.2381999 1.043 In 9/10 (90%) of the cases in which the Arctic Oscillation averaged +1.000 or above in December, January's figure was also > 0. The lone exception occurred in Winter 1979-80.
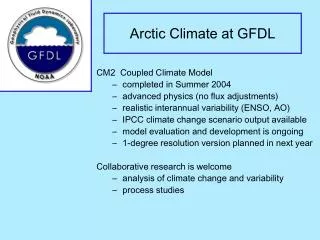
AO in December and Trend in the Following January Temperature Anomalies for the January Following Record +AO Decembers Temperature Anomalies for Record +AO Decembers
AO in December and Trend in the Following January (Don S.) In terms of snowfall, such winters proved generally less snowy than average across much of the East. Median seasonal snowfall for select cities:Boston: 23.5"Buffalo: 80.7"Burlington: 77.6"Chicago: 39.6"New York City: 14.6"Philadelphia: 15.4"Pittsburgh: 30.5"Washington, DC (DCA): 9.2"How December fares in terms of snowfall could provide a crucial indication as to how snowfall in the East will fare. Mean December snowfall for the sample of strongly positive Arctic Oscillation years came to 1.1”. Moreover, 10/10 (100%) of those seasons had less than 6” snowfall in December.
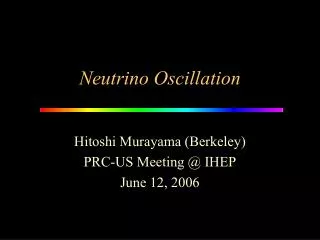
AO and NAO Correlation Interananually, the NAO and AO indices are similar, with a correlation of 0.74. However, differences remain quite notable for some periods as the year of 1974, 1980, 1981, 1983 and 1985 during which the two indices are nearly out-of-phase. - Wang et al.)
AO and + EPO Correlation January 2007