Download
1 / 20
230 likes | 655 Views
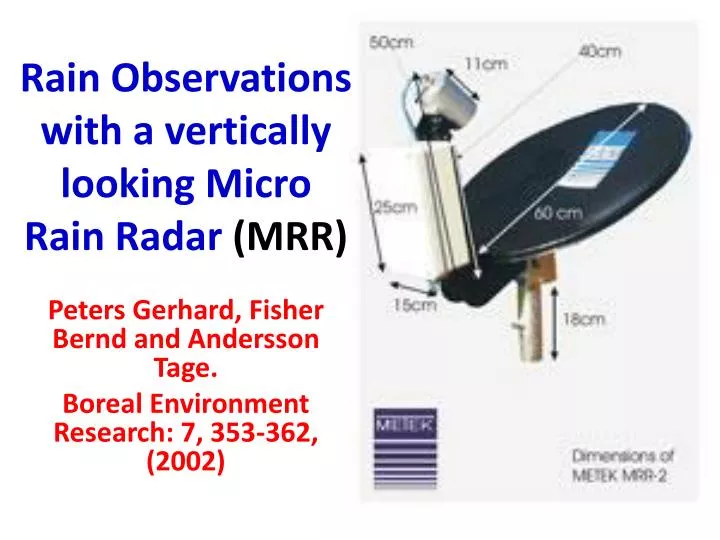
Rain Observations with a vertically looking Micro Rain Radar (MRR). Peters Gerhard, Fisher Bernd and Andersson Tage . Boreal Environment Research: 7, 353-362, (2002). BALTEX - GEWEX & PEP. Baltic Sea Experiment : Hydrological Cycle Global Energy and Water Cycle Experiment

E N D
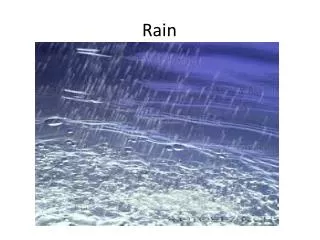
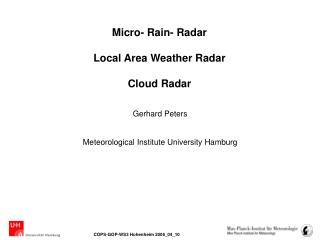
Rain Observations with a vertically looking Micro Rain Radar (MRR) Peters Gerhard, Fisher Bernd and AnderssonTage. Boreal Environment Research: 7, 353-362, (2002)
BALTEX- GEWEX & PEP • Baltic Sea Experiment : Hydrological Cycle • Global Energy and Water Cycle Experiment • Precipitation and Evaporation Project • Radar Rainfall • RR and Z depends on DSD • Height of Measuring Volume • Extrapolation of radar measuring volume to surface includes significant uncertainties
MRR • FM-CW Doppler radar (24.1 GHz) • Power transmit 50mWatt • 30 heights • Minimum RR is 0.01mm • DSD and W where is the single particle backscattering cross section, and is the spectral reflectivity as a function of the drop diameter D. Z is referred to as the Equivalent Radar Reflectivity factor with units of mm6 mm-3
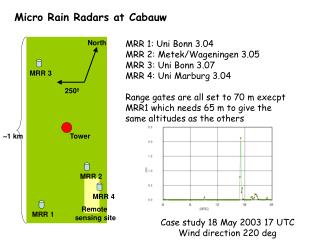
Set Up • Rainfall measurements • 1min • 50 m • German Baltic coast Zingst Peninsula • Comparison with tipping bucket Rain Gauge • 30 minute • 5 months (summer)
MRRvs Weather Radar • What is the Biggest source of Error with MRR measurements ? • When Mie theory is Applied? • When the Rayleigh Approximation is Applied? • What’s About the Weather radar wavelength (λ = 5 cm to 10 cm) σ = 2700 to 3000 MHz (S-band) • MRR (σ = 24.1 GHz or 1,24 cm) DSD and RR versus Z • Vertical Updrift Winds Mie scattering occurs when the particles in the atmosphere are the same size as the wavelengths being scattered Drops Diameter smaller in comparison to the wavelength of light
Peters et. al (2002) • What is main Assumptions Peters et al. did raise for this study: Liquid Precipitation • What is the Rainfall Rate classification scheme they used • 0.25 mm hr-1 • Height Resolution was set to: 50m • Which Gate was Selected: 10th
Peters et. al (2002) • Rain Gauge: Rainfall F and Resolution ΔF • Rain Rate Resolution ΔR = ΔF / Δt • Define the contribution of certain R to the total rainfall. Frequency of High RR has increased Duration of most events < 30 min Averaging process: underestimation of the actual occurring RR They concluded that: 1 minute resolution is not enough to reveal the true distribution of rain rate • Which Rain Rates Contributed most? 0 – 0.25 mmhr-1
Peters et al. (2002) ΔR / R = 0.05 • Differential water column (mm/mm hr-1) Maximum Contribution From rain rate around 0.2 mm hr-1 Highest rainfall Contribution From rain rate around ≤ 0.3 mm hr-1 The resolution of the gauge is not sufficient to represent rain rate classes
Peters et al. (2002) Spectral Peak of velocity is about 6 m s-1at lower gates Above 1100m peak shift to 2 m s-1 Meting level appears as: 1- Enhanced Reflectivity 2- Step in Fall Velocity 3- Apparent increase of RR
Peters et al. (2002) Comparison with Weather Radar: DWD 9 hours of sampling 51.48 km 900m lowest WR measuring volume Averaged of two subsequent samples of WR volumes MRR data averaged between 500 and 1400m MRR vertical resolution 100 m
Peters et al. (2002) Reflectivities below -5dBZ are missing, in weather radar (WR) data probably because they fall below the detectable threshold Agreement between MRR Reflectivity and WRsuggests that MRR measurements could be used for continuously updating the Z-R relationship WRmeasurements could be linked to the rainfall at the surface by the use of MRR profiles
Investigation of vertical profile of rain microstructure at Ahmedabad in Indian tropical region Saurabh Das, Ashish K. Shuklaand and AnimeshMaitra. Advances in Space Research 45 (2010) 1325-1243
Das et al. (2010) Set Up 1- MRR 30 seconds 200m (up to 6km) 2- Disdrometer 30 seconds • Rain Attenuation • Rain Classification • Vertical Profiles of rain microstructure • DSD • Rain Rate • Liquid water content • Average Fall speed of drops • Compare MRR DSD to Disdrometer Assumptions and Corrections for MRR: 1- W for lower air velocities 2- Errors due to non-spherical drops ~ 6% at 10mm/hr are neglected
Das et al. (2010) • Disdrometer • Transform vertical momentum of drops to an electrical signal (where: amplitude is f(DD)) • Terminal Velocity Drop diameter (Gunn & Kinzer 1949) • Drop Size in 20 bins Range 0 – 5.5 mm • DSD Rain Rate Rain Classification Scheme Based on: Vertical Reflectivity profile Assumptions 1- Momentum is due entirely to fall velocity 2- Drops are spherical 3 - Acoustic Noise Errors are neglected 4-Dead Time correction not applied 1- Stratiform 2- Mixed 3- Convective
Das et al. (2010) Radar reflectivity profile for: • 16:21:30–20:43:30UTC of 15/08/2006; (b) 02:42:30–11:47:30 UTC of 01/08/2006; (c) 20:39:30-23:55:00 UTC of 03/07/2006. 16:21:30–20:43:30UTC of 15/08/2006 Max R is 10.02 mm/hr BB at 4.6 - 5.2 km 16:42:30UTCno bright band is visible Convective 17:10:30UTCbright bands with two peaks Mixed 17:33:30UTC a clear bb structure is visibleStratiform
Das et al. (2010) 16:42:30UTCConvective 17:33:30UTCStratiform 17:10:30UTCMixed
Das et al. (2010) 15/08/2006 16:40:00 to 16:44:30 Convective 3a Z 3b Rain Rate 3c LWC 3d W 3e Mean Drop Diameter 3f DSD
Das et al. (2010) 15/08/2006 17:08:30 to 17:13:30 Mixed 3a Z 3b Rain Rate 3c LWC 3d W 3e Mean Drop Diameter 3f DSD
Das et al. (2010) 15/08/2006 17:28:30 to 17:33:30 Stratiform 3a Z 3bRain Rate 3c LWC 3d W 3e Mean Drop Diameter 3f DSD
Das et al. (2010) MRR vs Disdrometer 1- good agreement between MRR and Disdrometer rainfall (r = 0.8) 2- Scattering is higher above 2.5 mm/hr 3- Stratiform Rain Bigger Drop Sizes near ground level (7c) 4- Convective Drops 0.5 mm are dominant 5- Stratiform Drops are also around 1mm 6- Mixed showed a mixture of drops sizes (7b) MRR show very high concentration of smaller drops (7a) MRR measures drops in range 0.245 – 5.03 mm Disdrometer measures drops in range 0.3-5.5 mm MRR is more sensitive to smaller Drops