Download
1 / 36
360 likes | 563 Views
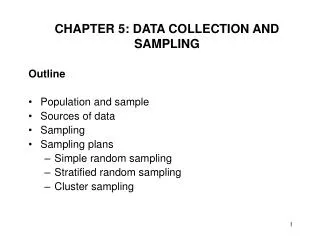
Sampling and Collection in the Occupational Employment Statistics (OES) Program. Dixie Sommers and Laurie Salmon Occupational Information Development Advisory Panel May 4, 2011. Overview. Data available from OES Uses and users of OES data Standard classifications used OES sample design

E N D
Sampling and Collection in the Occupational Employment Statistics (OES) Program Dixie Sommers and Laurie Salmon Occupational Information Development Advisory Panel May 4, 2011
Overview • Data available from OES • Uses and users of OES data • Standard classifications used • OES sample design • OES survey operations • OES estimation methods • Special OES tabulations for O*NET
Occupational Employment Statistics • Employment and wages for over 800 occupations • Cross-industry estimates for • The Nation • States, District of Columbia, and selected territories • Over 580 metropolitan and nonmetropolitan areas • National estimates by specific industries • Estimates by ownership • Published annually with May reference date • May 2010 data to be published May 17, 2011
Data items available • Employment • Hourly and annual mean wages • Hourly and annual wages by percentile • 10th, 25th, median, 75th, 90thpercentiles • Measure of sampling error • Employment and mean wage percent relative standard errors (PRSEs)
Uses and users • Employers and Human Resources professionals • Compare pay to data for their industry or area • Understanding occupational employment and wages in making location and expansion decisions • Academic researchers • Understanding the structure of the labor market • Understanding wages • Media and general public
Uses and users • Career and job search information • Studentsand job seekers • Guidance and career counselors • Policy and program uses • E.g., wages for Foreign Labor Certification • Staffing patterns uses • Preparing employment projections • O*NET sampling design to identify industries with concentrations of employment in occupations being surveyed
Industry classification • North American Industrial Classification System (NAICS) • Establishments are classified according to the goods or services the establishment produces • Issued by Office of Management and Budget • Jointly developed by U.S., Canada, and Mexico • U.S. Economic Classification Policy Committee chaired by Census Bureau • Revised every five years (2002, 2007, 2012)
Industry classification NAICS example
Occupational classification • Standard Occupational Classification (SOC) • Workers and jobs are classified into occupations based on the work performed • Issued by Office of Management and Budget • Standard Occupational Classification Policy Committee chaired by BLS • Established SOC Classification Principles and Coding Guidelines • Revised 2000 and 2010 • Next revision planned for 2018
Occupational classification 2010 SOC structure
Occupational classification SOC Example
Occupational classification • SOC Manual provides approved modifications to the structure • Delineation below the detailed occupation level permitted • Add digits to the code • 11-3031 Financial Managers • 11-3031.01 Treasurers and Controllers • OMB recommends that those needing extra detail use the O*NET structure
Occupational classification • All Federal agencies publishing occupational data for statistical purposes required to use SOC • Increases data comparability across Federal programs • SOC developed for statistical purposes only • Non-statistical purposes play no role in SOC development • OMB will not modify the SOC to meet requirements of non-statistical programs
Using industries and occupations together • The combination of industry and occupation can further define the work • E.g., retail salesperson may work selling cars and may need to drive. Others may work in stores and need to stand. • OES provides these data • Distribution of an occupation’s employment by industry • Distribution of an industry’s employment by occupation (staffing pattern)
OES methodology • Sample design • Data collection cycle • Estimation
OES sample design • Sampling frame • Unemployment insurance list of employers • Covers 98 percent of wage and salary jobs • Industry, county and employment level for each establishment • Supplemented by other sources for industries not covered by state unemployment insurance • Mainly Federal government and railroads • Universe and sample sizes • Universe size of about 8 million establishments • 1.2 million establishments in OES sample
OES sample design • Sample stratification • By metropolitan and non-metropolitan area • By industry strata • Generally 4-digit NAICS, some 5-digit NAICS • By ownership for certain sectors • Education and hospitals by state government, local government, and private ownership
OES sample design • Sample allocation for each stratum • Include all large establishments • “Certainty units” • Improves sample efficiency • For all other units • Based on expected variability and stratum size • Minimum number of sample units
Data collection cycle • Full sample collected over 3-year cycle • Two collection panels per year • Reference dates of May and November
OES Survey Operations • OMB clearance • Operational structure • Data collection and processing
OMB clearance • OMB clearance to conduct the survey • Requires • Description of purpose and uses • No duplication of other federal data sources • Detailed sample description • Description of respondent burden hours and cost • Response rate targets • Use of standard classification systems • Description of collection methods • Public comment periods
Operational structure • Federal-State Cooperative Program • BLS National and Regional offices • State Workforce Agencies • BLS responsibilities • Concepts and procedures • Sample design and selection • Survey form design, printing and mailing • Data capture and estimation systems • Produce and publish estimates • Data quality assurance • Training and technical assistance • Confidentiality policy and procedures • Funding
Operational structure • State workforce agency responsibilities • Address refinement of sample units • Data collection, including non-response follow-up • Data processing and editing • Occupational coding • Estimates review and publication • Protect data confidentiality
OES survey forms • Developed through cognitive and field testing • For all types of establishments • Verify known information about the establishment: employment, industry • Request contact information for follow-up
OES survey forms • Structured forms • For medium size and larger establishments • Specific to individual industries or groups of industries • Lists occupations commonly found in the industry • Includes occupation definitions • Employer determines how SOC codes relate to establishment’s job categories
OES survey forms • Unstructured forms • For smaller establishments • For all non-responding establishments in the third follow-up mailing • Open-ended format • No occupations listed on form • Employer reports by own job categories • Data coded to SOC by state or regional office staff
OES survey forms • All forms • Request employment in the occupation by wage intervals • Wage intervals used to estimate wage means, medians, and percentiles
Data collection • Mailing • Includes form, letter, information sheet • Second and third mailings to non-respondents • Response mode options • Complete paper form and mail back • Complete form online • Phone response • Fax response • Provide electronic payroll file (mail or email) • Provide paper payroll listing
Data collection • Improving response rates • Pre-notification postcards • Telephone follow-up • Flexibility in reporting mode • Web site for respondents • Why respondent’s data are important • Provide publications • Confidentiality pledge • Training data collectors on reluctance aversion
Data collection • Response mode varies by establishment size • Response rates for most recent panel • 77.7 percent of establishments • 69.5 percent of employment
OES estimation methods • Use three years of data (six panels) • May 2010 data based on these panels: May 2010 November 2009 May 2009 November 2008 May 2008 November 2007 • Employment estimation • Sample weight adjustment • Benchmarked to industry employment level from external source
OES estimation methods • Wage estimation using wage interval data • BLS National Compensation Survey data used to estimate mean wages in each interval • BLS Employment Cost Index used to “age” wages collected in earlier panels • Wages estimation using wage rate data • Direct computation of means, medians, and percentiles • Wage rate data for in certain sectors • Federal government, U.S. Postal Service • State government in many states
Special tabulations for O*NET • Distribution of occupational employment by 6-digit NAICS • More detailed than published OES data • Shows industries and areas with most employment in the occupation • Useful for targeting sample selection on industries where occupation known to exist
Dixie SommersAssistant Commissioner, Office of Occupational Statistics and Employment Projections 202-691-5701Sommers.Dixie@bls.govLaurie SalmonSupervisory Economist, Division of Occupational Employment Statistics 202-691-5701Salmon.Laurie@bls.gov www.bls.gov/oes