Download
1 / 17
170 likes | 383 Views
Occupational Segregation and Employment Discrimination. The Data. There are differences, when you compare across genders and racial/ethnic groups in Hours of employment Wages Type of employment benefits. Wages and Income. Household Incomes – 2010 Median White - $54,620

E N D
The Data • There are differences, when you compare across gendersand racial/ethnic groups in • Hours of employment • Wages • Type of employment • benefits
Wages and Income • Household Incomes – 2010 • Median • White - $54,620 • Black - $32,068 • Hispanic $37,759 • Over $75K • White - 25.9% • Black - 14.1% • Hispanic – 17.3%
Wages • 2010: Median U.S. Annual Salary by Race and Sex • Percentage women to men • Men Women Total • Asian $48,672 $40,196 $44,460 82.6% • White $44,200 $35,568 $39,870 80.5% • Black $32,916 $30,784 $31,772 93.5% • Hispanic/Lat. $29,129 $26,416 $27,820 90.7% • Overall $42,848 $34,788 $38,844 81.2%
What Explains Pay Differentials • Compensable Factors in the job- higher pay as a reward for risk-taking, working in poor conditions and having to work unsocial hours, responsibility, effort • Differences in accumulated human capital - wages and salaries should help to compensate people for making an investment in education. There is an opportunity cost in acquiring qualifications - measured by the current earnings foregone by staying in full or part-time education. • Different skill levels - the gap between poorly skilled and highly skilled workers gets wider each year. One reason is that the demand for skilled labor(in both manufacturing and service sectors) grows more quickly than the demand for semi-skilled workers. This pushes up average pay levels. highly skilled workers are often in inelastic supply and rising demand forces up the "going wage rate" in a particular industry • Differences in productivity and revenue creation - workers whose efficiency is highest and ability to generate revenue for a firm should be rewarded with higher pay. • Union protection - many workers in low paid jobs do not have unions acting on their behalf to protect them from the power of employers. • Discrimination
What Explains Pay Differentials • However, there are anomalies • Job of secretary was a high-responsibility, higher pay job prior to WWI, when it was male-dominated than after it became a female-dominated job • The job does not seem to have changed much, although some have argued that he human capital of the applicant pool changed
The Causes of Differences In Pay • Locus of the Cause • Decisions of the individuals • Decisions of the organization • Decisions made in the past • Levels of analysis • Societal • Occupation-level • Organization-level • Within-Organization level
Only Some of These are Covered by Law • In general, EEO law covers • Decisions of Organizations • Past Effects of Decisions of Organizations • Actions Organizations Might take to Discourage Individuals from Making Decisions Relative to Employment
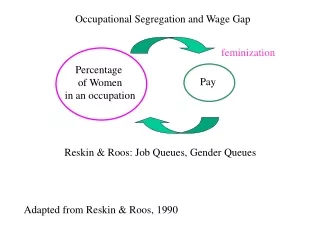
Measuring Occupational Segregation • Duncan’s D – indicates the % of women who would need to change jobs to achieve an even distribution • Across a set of jobs or occupation, compute • D = .5 * sum (|(mi/m) – (fi/f)|) • For example • D = .5*( |(5/90) – (50/90)| + |(50/90) – (5/90)|+ |(30/90) – (5/90)|+ |(5/90) – (30/90)| ) • D = .666
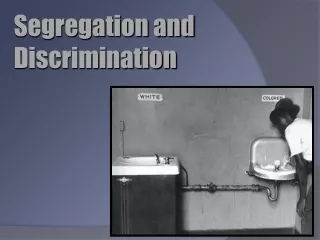
Segregation and Discrimination • Occupational Segregation and employment discrimination are different but probably related phenomena • Occupational Segregation probably increases employment discrimination • Employment discrimination is legal • Actions by covered organizations that contribution to occupational segregation may or may not be legal