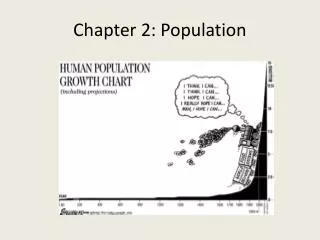
Demographic Transition: Population Growth Rates in Different Countries
This chapter explores the reasons behind population growth rates varying in different countries. It discusses the stages of demographic transition, including population pyramids, cultural factors, and economic conditions. Examples of countries in different stages are analyzed.


Demographic Transition: Population Growth Rates in Different Countries
E N D
Presentation Transcript
Chapter 2: Population Key Issue 3
Key Issue 3 • Why is Population Increasing at Different Rates in Different Countries? • The demographic transition • Population Pyramids • Countries in different stages of demographic transition • Demographic transition and world population growth
Demographic Transition • Countries experience changes in natural increase, fertility and mortality rate at different times & at different rates • Differences in local culture and economic conditions
Demographic Transition • Several stages: beginning, middle & end • Stage 1: Low Growth • Stage 2: High Growth • Stage 3: Moderate Growth • Stage 4: Low Growth
Stage 1: Low Growth • Early civilization • High levels of birth & death rates • NIR of zero • People depended on hunting & gathering for food • Access to food varied by year, increasing or decreasing population
Stage 1: Low Growth • Agricultural Revolution • People domesticated plants & animals • Created a stable source of food • Population began to increase • Unfavorable harvests could still result in low food production • War and disease also affected population growth
Stage 1: Low Growth • No country remains in stage 1 today
Stage 2: High Growth • Due to Agricultural Revolution, population grew • Around 1750, pop. Inc10x faster • CDR decreased, CBR remains about the same • Margin causes increase in population (NIR)
Stage 2: High Growth • Industrial Revolution • Began in England, 1750 • Spread to Europe & North America • Industrial technology (steam engine, mass production, powered transportation) • Led to wealth: • Improved sanitation • Food & water supplies
Stage 2: High Growth • Africa, Asia, Latin America • Did not reach stage 2 until 1950s+ • Medical Revolution • Eliminated traditional causes of death • Longer & healthier lives • Ex: vaccines, penicillin & insecticides
Stage 3: Moderate Growth • Reached when CBR drops sharply • Began in Europe & North America in 1900s • Social customs cause CBR to drop • People CHOOSE to have less children • Improved probability of infant survival • Economic changes: • Large families no longer needed for farms • Families moved to city jobs • Children become more expensive in urban areas
Stage 4: Low Growth • CBR is equal to CDR, NIR approaches ZERO • Zero Population Growth (ZPG) • A TFRapprox 2.1 produces ZPG • Immigration can affect ZPG, where TFR needs to be even lower
Stage 4: Low Growth • Social Customs changing population • Women entered work force • Shift away from farm jobs • Daycare for young children • Birth control • More wealth Inc. in leisure time, not suitable for children
Stage 4: Low Growth • Russia (Eastern Europe) • Negative NIR, deaths exceed births • Cause: Communist Rule • Indadequate pollution control • Pessimism about having children
Demographic Transition • Countries that pass through all four stages have completed a cycle • Stage 1: ZPG to Stage 4: ZPG • Stage 1: high CBR & CDR • Stage 4: low CBR & CDR
The Demographic Transition in England • Good Case Study: • accurate records of population (past 1000yrs) • No boundary changes • Not greatly affected by migration
Writing Assignment • Explain the Demographic Transition • Define each stage • Explain what leads to each transition to next stage • Provide examples
Population Pyramids • Stage of Demographic Transition determines what population of a country looks like • Percentage of each age group • Gender distribution
Population Pyramids • A bar graph that displays a country’s population by age and gender • Percentage of total population in 5yr age groups, youngest at bottom, oldest at top • Percentage of males, females represented by length of bars
Population Pyramids • CBR determines shape of pyramid • Stage 2 country: high growth • High CBR, large number of children • Broad base of pyramid (wide at bottom) • Stage 4 country: low growth • Large number of older people • Broad top of pyramid
Age Distribution • Dependency ratio: number of people who are too young or too old to work, compared to people in productive years • Dependents are: 0-14 and 65+yrs old • Determine dependency ratio of classroom
Age Distribution • Stage 2 • 50% of population are dependents (1:2) • Young dependents outnumber elder dependents 10:1 • Stage 4 • 33% of population are dependents (1:1) • Amt of young dependents = Elder dependents • How will amount and age of dependents impact a society?
Age Distribution • Sub-Sahara Africa & Stage 2 (high-growth) countries • Large percentage of pop. under age 15 • Strains country’s resources • Hospitals, schools, daycare • Job scarcity post high school
Age Distribution • Percentage of elders increases as countries move towards Stage 4 of Dem. Trans. • Declining CBRs • Improved medical care • Higher incomes • Europe: 65+ is 16% of population • Sub-Saharan Africa: 65+ is 3% of population
Age Distribution • United States, Canada, Japan, Europe • More than ¼ of gov’t expenditures go to health care, Social Security & programs for older populations • Stage 3 & 4 countries • Higher population of elderly • Causes higher CDR • What concerns are there with our aging population?
Sex Ratio • Number of males per hundred females in a population • Slightly more males born than female • Males have higher death rates • Europe & North America 95: 100 (m:f) • Rest of world is 102:100 (m:f) • What could be the reason?
Life Expectancy Shrinks for Poor People in the US • Read newspaper article and answer questions
Sex Ratio • United States • Under age 15yrs old, 105:100 (m:f) • Women outnumber men around age 40 • Why???? • 58% of population 65+ are women
Sex Ratio • LDCs • High mortality rate during childbirth • Larger percentage of young people (males outnumber females) • Lower percentage of older people (females are more numerous)
Population Pyramids What could explain these differences in age and gender throughout the United States?
Similar Population PyramidsWhy??? • What do you know about birth rates for African-Americans and Hispanics?
What do we know about these locations? How does that help explain the age distribution?
Countries in Different Stages of Demographic Transition • Stage 1: low growth: none • Stage 2: high growth: Cape Verde • Stage 3: moderate growth: Chile • Stage 4: low growth: Denmark
Cape Verde: Stage 2 • 12 small islands off the coast • of W Africa • Famine kept it in Stage 1 until 1950 • Antimalarial campaign moved it to Stage 2
Chile: Stage 3 • Shifted from rural to urban • Moved from Stage 1 to 2 with medical advancements (smallpox, malaria) • Moved to Stage 3 because of gov’t family planning initiatives, 1966 • (prevented abortions for unwanted births) • Reversed family planning policies, 1970 • Chileans continue to have large families • Large Catholic population
Denmark: Stage 4 • Similar to England’s trends in population • Since 1970s, CBR = CDR…ZPG • Population is only increasing from immigration