Chapter 2 Population
Chapter 2 Population. Key Issues Where is the worlds population distributed? Where has the worlds population increased Why is population increasing at different rates in different countries? Why might the world face an over population problem?. http://www.youtube.com/watch?v=E8dkWQVFAoA.

Chapter 2 Population
E N D
Presentation Transcript
Chapter 2 Population Key Issues Where is the worlds population distributed? Where has the worlds population increased Why is population increasing at different rates in different countries? Why might the world face an over population problem? http://www.youtube.com/watch?v=E8dkWQVFAoA
Read the intro • The study of population is important for three reasons • 1. There is more people alive today then any other time in history • 2. The population rate has increased more then any other time • 3. Almost all population growth can be found in LDC • The study of population characteristics- demography • Geographers need to look at where, why and the scale of population in different regions, Why could this be a problem?
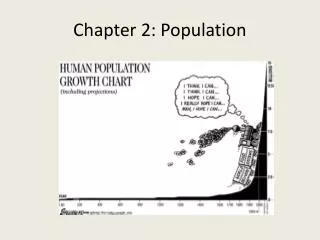
Health and Theory of Population A Major demographic shift began about 1750 as the world’s population turned upward, reaching the 1 billion mark by 1800. This milestone was repeated by 1930—barely a century later—when a second billion people were added to the planet. Global population reached 3 billion by 1962 and 4 billion by 1974. The rate of world population has increase has slowed recently, but our planet passed the 5 billion mark in 1987 and the 6 billion mark in late 1999.
Human Population The collapse of the first civilization on earth, the Summerian, affected only a half a million. The fall of Rome affected tens of millions. If ours were to fail... it would bring catastrophe on billions. Directly or indirectly, the human species already captures nearly 40% of the total biological productivity on land and 70% of the productivity of the marine environment – the “net primary productivity” of the planet – for its exclusive use. The rate of increase in human use is about 2% per year.
History of Population Change • Subsistence agriculture • 10000 BC First Agricultural Revolution- • 1700’s- Industrial Revolution • Second Agricultural Revolution- Urbanization occurred • Commercial farming and movement - gmo • Periods of economic- gnp- baby boom
Key Issue 1- Where is the Population Distributed? • Population Concentrations • ¾ the population lives on 5% of the earth • East Asia, Southeast Asia, Western Europe, Eastern North America • This can be seen on a cartogram- map showing population rather then actual size • 2/3 the population lives within 300 miles of water, Why? • 4/5ths live within 500 miles • All regions are located between 10 and 55 degree latitude • Pg 40 cartogram
East Asia • ¼ the earth population live here • China, Japan, Korea, Taiwan • Of this 5/6 of these people live in China • Over 3/4ths of these inhabitants live in rural areas • Japanese and Taiwanese 3/4ths live in urban areas • South Asia • 1/5th the population lives in India, Pakistan, Bangladesh, Sri Lanka • Along the Indus River and the Ganges • 3/4ths of these people live in rural settings
Southeast Asia • 4th largest area of population, Java, Sumatra, Borneo, Papua New Guinea and the Philippines • The three Asian regions consist of over half the worlds population • Europe • 3rd largest population cluster, 18th the people on earth • 3/4ths these people live in the cities • England, Germany and Belgium hold the highest population • They do not produce enough agriculture to support their population where do they get their food?
Where is the World’s Population Distributed? Global population is concentrated in a few places. Human beings tend to avoid those parts of Earth’s surface that they consider to be too wet, too dry, too cold or too mountainous. The capacity of Earth to support a much larger population depends heavily on people’s ability to use sparsely settled lands more effectively.
Basics of Demography • Demography- study of human pop. • Why? Strains Infrastructure- support systems • How?
Scale of inquiry- size of your investigation Global vs. Local- LDC’s vs. MDC’s Demographic Accounting Equation Global- P0– size at start P1- at end B- births during D- deaths during P1=P0+B-D Sub- Global P0– size at start P1- at end B- births during D- deaths during I- Immigrants E-emigrants P1=P0+B-D+I-E Immigrant- “I” for coming in Emigrant- “E” for exit Why are these not counted in the Global Equation? Population Equation
Population Distribution • Distribution- the pattern of people across the earths surface • Unevenly and around water • ¾ of the pop lives on 5% of the earths surface • Ecumene- sustained population
Land Surveys • Homestead act of 1862- • uniform pattern- • nucleus pattern- • long lot
World Population Cartogram Fig. 2-1: This cartogram displays countries by the size of their population rather than their land area.(Only countries with 50 million or more people are named.)
Eastern North America • 2% of the population, located along the eastern U.S.A. and the southeast Canada • 95% of these people live in the cities • Sparsely Populated Regions • Ecumene- portion of the earth that permanently populates an area • People avoid certain areas, Why? What are some examples?
Dry Lands • 20% of the earth surface, the largest include the Sahara, Arabian, Thar, Takla Makan, Gobi • Lack of natural resources, such as what? • What natural resource do they have? • Wet Lands • 50 inches of rain a year, high heat and rain deplete the soil • Southeast Asia, South America • Cold Lands • North and South poles covered in Permafrost • Cant grow right? • High lands • Steep snow covered, Mexico is an exception living about 7,360 ft above sea level
World Population Distribution & Climate Zones Fig. 2-2: World population is unevenly distributed across the earth’s surface. Climate is one factor that affects population density.
Population Density • Number of people occupying land • Arithmetic Density • Total # of people divided by land mass • U.S. has 77 persons per sq. Mile • This number adjust as you measure different aspects, Manhattan has about 55,400 per sq. mile, why? • This explains the where question
Physiological Density • Arable land- Farm Land • # of people supported by Arable land • U.S. 404 persons per sq mile, Egypt 9073 per sq, shows us that Egypt must feed more people with this land • Agricultural Density • Two places can be similar but their Farming Density could be different • The ratio between farmers and the amount of farms • U.S. has 4 per sq kilo, Egypt has 1401 per sq Kilo • What can this tell us about technology and where production is being made • Limiting/regulating factor-
Arithmetic Population Density Fig. 2-4: Arithmetic population density is the number of people per total land area. The highest densities are found in parts of Asia and Europe.
Physiological Density Fig. 2-5: Physiological density is the number of people per arable land area. This is a good measure of the relation between population and agricultural resources in a society.
Key Issue 2- Where has the worlds population increased? • Geographers can measure this 3 ways • Crude Birth Rate- love birth rate compared to 1000, so 20 would mean 20 births per year for every 1000 • Crude Death Rate- Deaths every year per 1000, What happens when the death rate is faster then the birth rate? How about the opposite? • Natural Increase Rate- CBR-CDR
Natural Increase • Natural Increase – this is now 1.2 % per year, but regional differences mean that most of the world’s additional people live in countries that are least able to maintain them. • Doubling Time- the % of time it takes to double the population, in the 60s- 35 years 2000- 51 years what does this tell us? • Virtually 100% of the Natural Increase is located in the LDC, WHY? • Total Fertility Rate • Fertility – this is ~2.7 for the world today, but varies greatly by region with many sub-Saharan countries exceeding 6 compared to less than 2 in nearly every European country. • The average amount children a women will have throughout her life • For the world its around 3, In Africa its above 6- in the U.S. lower then 1 • High School Diploma in the USA- Avg 3 Kids- without 7
Tool Box for Population • http://www.youtube.com/watch?v=dD-yN2G5BY0&feature=related • Crude Birth Rate- love birth rate compared to 1000, so 20 would mean 20 births per year for every 1000 • Crude Death Rate- Deaths every year per 1000, What happens when the death rate is faster then the birth rate? How about the opposite? • Natural Increase Rate- CBR-CDR • Doubling Time- the % of time it takes to double the population, in the 60s- 35 years 2000- 51 years what does this tell us? • Virtually 100% of the Natural Increase is located in the LDC, WHY? • Total Fertility Rate • Fecundity- Ability of women to conceive- Higher in larger women • General Fertility Rate- GFR- number of births in her fecund years • Fertility – this is ~3.0 for the world today, but varies greatly by region with many sub-Saharan countries exceeding 6 compared to less than 2 in nearly every European country. • The average amount children a women will have throughout her life • For the world its around 3, In Africa its above 6- in the U.S. lower then 1 • Infant Mortality Rate- deaths of infants within one year, per 1000 people • Mortality – is related to infant mortality (the annual number of deaths of infants under 1 year of age compared with total live births) and life expectancy (at birth measures the average number of years a newborn can expect to live)
In LDC’s 10%, In MDC’s considerable different • U.S. has a high rate compared to Europe and Canada- Minorities in the states have double the likelihood compared to Latin America and Asia • This is attributed that there is a large portion of Minorities that cannot afford good health care, Do you think the new health care bill will help this? • Life expectancy- the average life of an infant- 70’s in W. Europe, 40s in Sub-Sahara Africa • What happens when the LDC are living longer then the MDC
Mortality • Mortality – is related to infant mortality (the annual number of deaths of infants under 1 year of age compared with total live births) and life expectancy (at birth measures the average number of years a newborn can expect to live) • Infant Mortality Rate- deaths of infants within one year, per 1000 people • In LDC’s 10%, In MDC’s considerable different • U.S. has a high rate compared to Europe and Canada- Minorities in the states have double the likelihood compared to Latin America and Asia • This is attributed that there is a large portion of Minorities that cannot afford good health care, Do you think the new health care bill will help this? • Life expectancy- the average life of an infant- 70’s in W. Europe, 40s in Sub-Sahara Africa • What happens when the LDC are living longer then the MDC
World Population Growth1950 - 2005 Fig. 2-6: Total world population increased from 2.5 to over 6 billion in slightly over 50 years. The natural increase rate peaked in the early 1960s and has declined since, but the number of people added each year did not peak until 1990.
Natural Increase Rates Fig. 2-7:The natural increase rate (NIR) is the percentage growth or decline in the population of a country per year (not including net migration). Countries in Africa and Southwest Asia have the highest current rates, while Russia and some European countries have negative rates.
Crude Birth Rates Fig. 2-8: The crude birth rate (CBR) is the total number of births in a country per 1000 population per year. The lowest rates are in Europe, and the highest rates are in Africa and several Asian countries.
Crude Death Rates Fig. 2-9: The Total fertility rate (TFR) is the number of children an average woman in a society will have through her childbearing years. The lowest rates are in Europe, and the highest are in Africa and parts of the Middle East.
Infant Mortality Rates Fig. 2-10: The infant mortality rate is the number of infant deaths per 1000 live births per year. The highest infant mortality rates are found in some of the poorest countries of Africa and Asia.
Life Expectancy at birth Fig. 2-11: Life expectancy at birth is the average number of years a newborn infant can expect to live. The highest life expectancies are generally in the wealthiest countries, and the lowest in the poorest countries.
Percent of Population Under Age 15 Fig. 2-12: The crude death rate (CDR) is the total number of deaths in a country per 1000 population per year. Because wealthy countries are in a late stage of the Demographic Transition, they often have a higher CDR than poorer countries.
Replacement and Mortality • Replacement level fertility- replace the pop • Zero-Pop- Growth- =0 • Rate of natural increase- CBR-CDR/10 • Roughly 1.2%- Around 50 years • Doubling Time- the % of time it takes to double the population, in the 60s- 35 years 2000- 51 years what does this tell us? • Doubling rate and the rule of 70 • Can differ in Pronatalist Populations
Population Policies • Pronatalist • Hitler, Mao Zedong,- Population is Power • East Germany today
Antinatalist • 1980-China- one-child policy • Female Infanticide • Changes Sex-ratio • Led to spread of disease • USA 20’s-60’s • About 60 million abortions per year