Download
1 / 27
280 likes | 359 Views
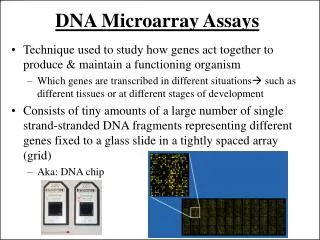
This study delves into cutting-edge immunophenotyping methods and functional assays for analyzing immune cell populations. From advanced flow cytometry techniques to cytokine analysis and transcriptomics, discover how these tools revolutionize biomedical research. Uncover insights into CyTOF analysis, SPADE, CITRUS, and manual gating for cell subset identification. Dive into functional assays like P2X7 inhibition and LPS challenges, shedding light on cytokine production mechanisms. With a focus on sample quality and data interpretation, navigate the complexities of analyzing immune responses at a cellular level.

E N D
BIDOEP Immunophenotyping and functional assays NIMA F2F 15th Dec 2017 Lorinda Turner
Primary cohort MACS Immunophenotyping (Cryopreserved 1-2 aliquots) 6 x 9ml EDTA tubes PBMCs Pool and centrifuge over histopaque to obtain PBMCs PAXgene RNA tube Straight into -80 freezer Whole blood transcriptomics Cytokine analysis Transcriptomics Centrifuge to separate serum/plasma 1 x SST tube 1 x PPT tube PBMCs Secondary cohort Transcriptomics (1 x 10⁶ stored in RLT) Centrifuge to separate serum/plasma Immunophenotyping (Cryopreserved 1-2 aliquots) PAXgene RNA tube Whole blood transcriptomics 1 x SST tube 1 x PPT tube 1 x 9ml EDTA tubes Cytokine analysis Obtain PBMCs as above
Tandem dyes will fluoresce in all three channels that they are composed of Degraded fluorochromes couple with fluorochromes attached to other antibodies and create weird populations
Second problem 245 samples had already been used Not every sample had a second aliquot to use Many did not have enough viable cells 75 % Viability 50 25 300 400 200 500 100 0 Days spent in liquid nitrogen
Cytof panel • Mass cytometry uses heavy-metal tagged antibodies • Very little spillover between parameters • ~135 channels • Can detect ~40 parameters in a single cell suspension • Samples can be ‘barcoded’ allowing batches of up to 20 samples at a time • Reduces sample to sample variation as all samples are stained together in one tube • Reduces cost of reagents and of machine time • 170 samples remaining, 110 expected to be of sufficient quality • CD11c, CD4, CD86, CD38, CXCR3, CD24, CD19, CD20, CD80, CD14, CD141, CD123, IgD, CD56, CD161, HLADR, CD57, CD3, CCR6, CCR4, CD8, CD45, CD16, CCR7, CD27, CD127, CD146, CCR2, CD10, CD5, CD45RA, CD25, CD122, CXCR5
Cytof analysis • SPADE • Spanning-tree Progression Analysis of Density-normalized events • Unsupervised identification of populations based on marker expression • Not subject to ‘gater-bias’ • Traditional guided manual gating • CITRUS • Cluster identification, characterization and regression • Unsupervised and supervised machine learning pipeline to automatically find biomarkers that are correlated with an outcome group
Cytof samples • To date • Controls : 15 • DEP-MED+ : 10 • DEP+MED- : 21 • DEP+MED+ : 25 • Interpret the following with caution!! • Expected • Controls : 17 • DEP-MED+ : 16 • DEP+MED- : 25 • DEP+MED+ : 46 • Secondary cohort 135
SPADE analysis CD4 CD20 CD56
SPADE Node 41 0.03 0.02 Proportion of Live CD45+ 0.01 0 Controls DEP-MED+ DEP+MED- DEP+MED+ CD192
SPADE -- CD192 / CCR2 expression 1633 - Control 3025 – DEP+MED+
Guided manual gating of cytof data Ratio of CCR2+ classical to non-classical monocytes 10 • Tedious • Prone to ‘gater-bias’ • Useful for validating CITRUS or SPADE results Log10 ratio 1 DEP+MED+ Controls DEP-MED+ DEP+MED-
CITRUS • Method of choice • Requires minimum of 8 samples per group but more if differences are not striking
Controls v DEP+MED+ Feature plot Red are statistically different cell subsets between groups
CD3- CD16hi, CD161mid, CD45RAhi, CD57hi, CD56hi, CD38hi CD16bright NK cell subset CD8+, CD5+, CD45RA+, CCR7-, CD57+ CD8+ EMRA T cell subset D+M+ D+M+ C C CD8+, CD5+, CD27+, CCR7+, CD127+, CD45RA+ Naïve CD8+ T cell subset CD161+, CD8lo, CD45RA+, CD57+, CD56+, CD3lo, CD16lo NKT cell subset D+M+ D+M+ C C 1 0.01 Log10 scale
P2X7 inhibition assays • Thawed cells were rested overnight • +/- P2X7 inhibitor (Janssen) • Stimulated with bzATP + LPS • Measured IL1b production by MSD • Samples with less than 70% viability removed +/- caspase 1 inhibitor to determine if the IL1b measured is realised through an inflammasome-mediated process or if it is just pro-IL1b released when the cells die
Percentage IL1b secretion relative to positive control (no inhibitor) 80 60 % IL-1b secretion 40 20 0
Non-stimulated (baseline) bzATP + LPS + caspase 1 inhibitor (pro IL-1b from cell death) bzATP + LPS + caspase1 inhibitor + P2X7 inhibitor (should be close to baseline) IL-1b (pg/ml) bzATP + LPS bzATP + LPS + P2X7 inhibitor
9 of 86 IL-1b (pg/ml)
LPS challenge and cytokine production • Thawed cells rested overnight • Stimulated with LPS for 4 hours (or non-stimulated baseline control) • Cytokine production measured by MSD • Samples with no post-LPS challenge cytokine induction in any cytokine were removed • Samples with less than 70% viability removed • CXCL9, IL6R, RANTES, Fractalkine, IL-10, IL-12, IL1b, IL-6, IL-8, TNFa, IL17-A, IL18, IP10, M-CSF, MCP-1, MIP1a, MIP1b, SDF1a
LPS – baseline Log transformed No significant differences between any of the groups for any cytokines
Primary cohort Immunophenotyping (Cryopreserved) 6 x 9ml EDTA tubes PBMCs Pool and centrifuge over histopaque to obtain PBMCs MACS PAXgene RNA tube Straight into -80 freezer Whole blood transcriptomics Cytokine analysis Transcriptomics Centrifuge to separate serum/plasma 1 x SST tube 1 x PPT tube PBMCs Secondary Cohort returning Transcriptomics (1 x 10⁶ stored in RLT) Centrifuge to separate serum/plasma Immunophenotyping (Cryopreserved) PAXgene RNA tube Whole blood transcriptomics 1 x SST tube 1 x PPT tube 1 x 9ml EDTA tubes Cytokine analysis Obtain PBMCs as above
Alison McColl NaghmehNikkheslat Dominika Wzazly, Anviti Vyas Dante Huang Alex Hatton Mateusz Strzelecki
RSD initiates brain-to-immune outflow via SNS and HPA axis activation. Enhanced myelopoeisis leads to production of primed and GC-resistant/insensitive myeloid cells. Hypothesis : increased CCR2+ classical monocyte proportions in the blood of DEP+ than controls CCR2+ Increased IL1b gene exp.