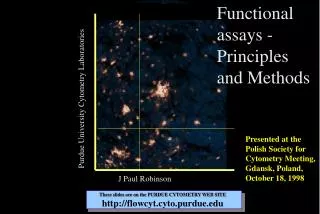
Functional assays - Principles and Methods
Functional assays - Principles and Methods. Purdue University Cytometry Laboratories. Presented at the Polish Society for Cytometry Meeting, Gdansk, Poland, October 18, 1998. J Paul Robinson. These slides are on the PURDUE CYTOMETRY WEB SITE http://flowcyt.cyto.purdue.edu.

Functional assays - Principles and Methods
E N D
Presentation Transcript
Functional assays - Principles and Methods Purdue University Cytometry Laboratories Presented at the Polish Society for Cytometry Meeting, Gdansk, Poland, October 18, 1998 J Paul Robinson These slides are on the PURDUE CYTOMETRY WEB SITE http://flowcyt.cyto.purdue.edu
Poland taken from Comsat C1 satellite October 15, 1998 - you can clearly see Warsaw in the center. Top center-left is Gdansk.
Gdansk Warsaw Krakow
The goals of this presentation are: • To identify the nature of functional assays in Cytometry • To expand on how they operate • To discuss the advantages and disadvantages of each • To discuss the application of these assays
Kinetics • Principle of Time Measurements • Live cells can be measured as easily as dead cells • You only need a small number of cells in a changing environment • End point assays can describe the activity of the cell
Cellular Functions • Ionic Flux Determinations • Calcium • Intracellular pH • Membrane Potential • Membrane Polarization • Lipid Peroxidation • Cell Viability • Phagocytosis • Organelle Function • mitochondria, ER • endosomes, Golgi • Oxidative Reactions • Superoxide • Hydrogen Peroxide • Nitric Oxide • Glutathione levels
What do we measure? Fluorescence TIME
Fluorescent Indicators How the assays work: • Superoxide: Utilizes hydroethidine the sodium borohydride reduced derivative of EB • Hydrogen Peroxide: DCFH-DA is freely permeable and enters the cell where cellular esterases hydrolyze the acetate moieties making a polar structure which remain in the cell. Oxidants (H2O2) oxidize the DCFH to fluorescent DCF • Glutathione: In human samples measured using 40 M monobromobimane which combines with GSH by means of glutathione-S-transferase. This reaction occurs within 10 minutes reaction time. • Nitric Oxide: DCFH-DA can also be used as an indicator for nitric oxide in a manner similar to H2O2
Organelle Function • Mitochondria Rhodamine 123 • Endosomes Ceramides • Golgi BODIPY-Ceramide • Endoplasmic Reticulum DiOC6(3) Carbocyanine
2’,7’-dichlorofluorescin diacetate O O CH3-C-O O O-C-CH3 2’,7’-dichlorofluorescin Cl Cl H COOH Fluorescent O HO OH Cl Cl Cellular Esterases H 2’,7’-dichlorofluorescein COOH Hydrolysis O HO O H2O2 Cl Cl H Oxidation COOH DCFH-DA Neutrophils DCFH-DA Monocytes 80 PMA-stimulated PMN Control 60 DCFH H O 2 2 counts Lymphocytes 40 DCF 20 0 .1 1 10 100 1000 log FITC Fluorescence DCFH-DA DCFH DCF
H2N NH2 H2N NH2 + Br- N N H CH2CH3 CH2CH3 DCF DCF Hydroethidine HE EB O2- Phagocytic Vacuole NADPH Oxidase NADPH O2 HE O2- NADP SOD H2O2 O2- H2O2 OH- Example: Neutrophil Oxidative Burst
Both these images are cells stained to measure for H2O2 production. Neutrophil Chondrocytes
Some examples of rapidly changing antigen expression systems Endothelial Adhesion Molecules Neutrophil Counter Ligand s-Lex (CD15s) P-selectin (CD62P) s-Lex, CD66, L-selectin, b2 integrins E-selectin (CD62E) Neutrophil Adhesion Molecules Endothelial Counter Ligand s-Lex (CD15s) L-selectin (CD62L) CD11a/CD18 ICAM-1 (CD54), ICAM-2 (CD102) CD11b/CD18 ICAM-1 (CD54), [iC3b, fibrinogen, factor X] CD11c/CD18 ?, [iC3b, fibrinogen]
L-selectin &CHO ligands (e.g. sLex) E-selectin & P-selectin CD11b ICAM-1 a c b d TNFa IL-1 BACTERIAL INFECTION Neutrophils Endothelial Cells The circulating neutrophil (a) and the initiation of rolling (b) as molecular tethers are formed between selectin and CHO ligands on neutrophils and endothelial cells. If an adequate number of tethers are formed, the neutrophil completely decelerates and with chemotactic stimulation of the neutrophil, L-selectin is rapidly shed while other receptors like E-selectin, CD11b and ICAM-1 are up-regulated by cytokines and other inflammatory mediators (c). Firm neutrophil/endothelial cell adhesion is mediated by CD11b and ICAM-1 and is followed by emigration of the neutrophil through the endothelium (d).
ICAM-1 E-selectin ? (NOO-) H2O2 O2- NO. OH- - - M VCAM + + + NO. + ROS + NFkB + + + + TNFa Bradykinin P-selectin CD11b Known and unknown interactions between neutrophils and endothelial cells. Nitric oxide (NO.) and reactive oxygen species (ROS) are produced by both neutrophils and endothelial cells thus the interaction between these reactive species becomes very complicated. Mmembrane damage conjugated dienes + stimulatory effect - inhibitory effect
Oxidative Reactions • Superoxide Hydroethidine • Hydrogen Peroxide Dichlorofluorescein • Glutathione levels Monobromobimane • Nitric Oxide Dichlorofluorescein
Rat Pulmonary Artery Endothelial Cells Oxidization via H2O2 Periodicity of Fluorescence Meridian UltimaTM Analysis Purdue University Cytometry Laboratories
Macrovascular Endothelial Cells in Culture 0 Time (minutes) 60
Confocal System Culture System
top view Step 1: Cell Culture 1 2 Step 2: Cell Wash 3 4 6 5 Step 3: Transfer to Lab-Tek plates 7 8 side view 170 M coverslip Lab-Tek Step 4: Addition of DCFH-DA, Indo-1, or HE stimulant/inhibitoradded 37oheatedstage confocalmicroscope oilimmersion objective
1 2 3 4 5 2000 cell 1 1800 1600 cell 2 1400 cell 3 1200 cell 4 1000 800 cell 5 600 400 200 0 0 500 1000 1500 2000 2500 3000 Time in seconds Hydrogen peroxide measurements with DCFH-DA Change in fluorescence was measured using Bio-Rad software and the data exported to a spread sheet for analysis. 525 nm Step 6B: Export data from measured regions to Microsoft Excel Step 7B: Export data from Excel data base to Delta Graph % change (DCF fluorescence)
cell 1 cell 3 cell 4 cell 2 cell 5 1800 1600 1400 cell 1 1200 1000 cell 2 800 600 cell 3 400 cell 4 200 0 cell 5 -200 200 400 600 800 1000 1200 1400 1600 1800 Time in seconds Superoxide measured with hydroethidine Change in fluorescence was measured using Bio-Rad software and the data exported to a spread sheet for analysis. Export data from measured regions to Microsoft Excel %change (DCF fluorescence) Export data from Excel data base to Delta Graph
Metamyelocyte Promyelocyte Myelocyte Neutrophil Padma Narayanan figures hl60.ppt
e1 36 30 0 ng/ml PMA 8 ng/ml PMA 24 50 ng/ml PMA 18 Change in Mean DCF Fluorescence d1 e 12 c1 b1 d 6 c a a b 0 0 HOURS 24 HOURS 48 HOURS 72 HOURS 96 HOURS
36 0 HOURS PMA (8 ng/ml) 30 0 HOURS PMA (50 ng/ml) 96 HOURS PMA (8 ng/ml) 24 96 HOURS PMA (50 ng/ml) 18 Change in Mean DCF Fluorescence 12 6 0 0 0.1 1 5 10 20 50 Diphenyleneiodonium chloride [mM]
HL-60 cells 20 DCF Fluorescence EB Fluorescence 15 10 Change in Mean Channel Fluorescence 5 0 Passage 60 Passage 28
Phagocytosis • How the assay works: • Particles or cells are labeled with a fluorescent probe • The cells and particles are mixed so phagocytosis takes place • The cells are mixed with a fluorescent absorber to remove fluorescence from membrane bound particles • The remaining fluorescence • represents internal particles • Uptake of Fluorescent labeled particles • Determination of intracellular or extracellular state of particles FITC-Labeled Bacteria
Trypan Blue FITC-Labeled Bacteria
pH Sensitive Indicators Probe Excitation Emission • SNARF-1 488 575 • BCECF 488 525/620 440/488 525 [2’,7’-bis-(carboxyethyl)-5,6-carboxyfluorescein]
Applications • Probe Ratioing • Calcium Flux (Indo-1) • pH indicators (BCECF, SNARF) Molecule-probe Excitation Emission Calcium - Indo-1 351 nm 405, >460 nm Calcium- Fluo-3 488 nm 525 nm Calcium - Fura-2 363 nm >500 nm Calcium - Calcium Green 488 nm 515 nm Magnesium - Mag-Indo-1 351 nm 405, >460 nm Phospholipase A- Acyl Pyrene 351 nm 405, >460 nm
0.8 0.7 0.6 0.5 0.4 Ratio: intensity of 460nm / 405nm signals 0.3 0.2 0.1 Stimulation Time (seconds) 0 0 36 72 108 144 180 Time (Seconds) 0 50 100 150 200 Flow Cytometry Image Analysis Ionic Flux Determinations • Calcium Indo-1 • Intracellular pH BCECF • How the assay works: • Fluorescent probes such as Indo-1 are able to bind to calcium in a ratiometric manner • The emission wavelength decreases as the probe binds available calcium
Ratio: intensity1 (460nm) / intensity2 (405/35nm) 0.8 cell 1 0.7 cell 2 0.6 cell 3 0.5 0.4 0.3 0.2 0.1 0 0 50 100 150 200 Calcium ratios with Indo-1 Changes in the fluorescence were measured using the Bio-Rad calcium ratioing software. The same region in each wave length was measured and the relative change in each region was recorded and exported to a spread sheet for analysis.. 1 1 2 2 3 3 460 nm 405/35 nm Export data from measured regions to Microsoft Excel Export data from Excel data base to Delta Graph
Probes for Ions • INDO-1 Ex350 Em405/480 • QUIN-2 Ex350 Em490 • Fluo-3 Ex488 Em525 • Fura -2 Ex330/360 Em510
PMA Added Green Fluorescence 0 512 1024 0 150 300 0 1200 2400 Time (sec) Membrane Potential • Cyanine Probes • How the assay works: • Carbocyanine dyes released into the surrounding media as cells depolarize • Because flow cytometers measure the internal cell fluorescence, the kinetic changes can be recorded as the re-distribution occurs • Oxanol Probes Repolarized Cells fMLP Added Green Fluorescence 0 512 1024 Depolarized Cells Time (sec)
Lipid Peroxidation • Probe: 5 M cis-paranaric acid (Molecular Probes) • How the assay works: • Cis-paranaric acid is a naturally fluorescent fatty acid which has 4 conjugated double bonds which become targeted by lipid peroxidation reactions with a subsequent loss of fluorescence
Lipid Peroxidation Paranaric Acid Over time - Paranaric acid loses its fluorescence as the double bonds are destroyed Cartoon of the curve that would be derived from the data at left. 0 1024 TIME (Seconds) TIME (Seconds) Data on left taken from Hedley, et al, Cytometry, 13: 686-692, 1992
“Caged” Photoactivatable Probes Principle: Nitrophenyl blocking groups e.g. nitrophenyl ethyl ester undergoes photolysis upon exposure to UV light at 340-350 nm • Ca++: Nitr-5 • Ca++ - buffering: Diazo-2 • IP3 • cAMP • cGMP • ATP • ATP--S Available Probes
Release of “Caged” Compounds UV Beam Culture dish Release of “Cage”
UV excited Control Region 250 200 150 100 50 Fluorescence Emission at 515 nm 0 0 20 40 60 80 100 120 140 160 0 Time (seconds) after UV FLASH Caged Nitric Oxide study Regions were selectively excited using UV light to release the cage nitric oxide. Images of the excited and adjacent control region were then collected. Export data from measured regions to Microsoft Excel Export data from Excel data dbase to Delta Graph
FRAP %F Intense laser Beam Bleaches Fluorescence Time Recovery of fluorescence 10 seconds Zero time 30 seconds
Conclusions & Summary Functional Studies In Cytometry • Oxygen radicals • Nitrogen radicals • Antioxidants • Cell viability • Organelle function • Lipid peroxidation • Membrane potential • Calcium fluxes • pH changes
Acknowledgements • Kathy Ragheb • Gretchen Lawler • Steve Kelley • Monica Shively • Dave Whittinghill • Stephanie Sincock • Karen Cornell • Karin Kooreman • Nian-Yu Li Padma Narayanan (Smith Kline) Wayne Carter (Pfizer)