Download

1 / 18
180 likes | 350 Views
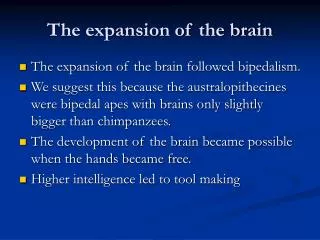
The structural organization of the Brain. Gray matter: nerve cell bodies (neurons), glial cells, capillaries, and short nerve cell extensions (axons and dendrites). Information processing.

E N D
The structural organization of the Brain Gray matter: nerve cell bodies (neurons), glial cells, capillaries, and short nerve cell extensions (axons and dendrites). Information processing Whitematter: bundles of myelinated nerve cell axons, which connect various gray matter areas of the brain to each other, and carry nerve impulses between neurons. Information transmission
Development of morphometric „in vivo“ techniques Voxel-Based Morphometry Diffusion Tensor Imaging Cortical Thickness volumetric analysisofRegions of Interest (ROIs)
Volumetric analysis of ROIs/VOIs Brain developmental trajectories Lenroot et al., 2007
Volumetric analysis cons: • Require a priori assumptions about ROIs • Detect only gross structural changes in GM, WM • Manual segmentation of brain tissue (Gray-White matter) and definition of ROIs is time consuming and subject to errors
Voxel-Based Morphometry • VBM is a voxel-based comparison of local tissue volumes within or across groups • Whole-brain analysis, does not require a priori assumptions about ROIs; unbiased way of localising structural changes • Can be automated, requires little user intervention compare to manual ROI tracing
SPATIALLY NORMALISED IMAGE WHITE MATTER CSF GREY MATTER Voxel Based Morphometry Aims to classify image as GM, WM or CSF Two sources of information a) Spatial prior probability maps b) Intensity information in the image itself
VBM Cons • Comparison of local tissue volumes: false positives due to misregistration of the images • Lack of accuracy: differences detected only at macroscopic scale • Poor understanding of the nature of GM/WM changing E.g. Increased gray matter volume could result from more folding as well as thicker gray matter
Cortical Thickness Changes across the axes of the cortical columns. It allows not only to determine significant difference between groups but also to measure this difference (in mm)
Cortical Thickness Measures the distance between outer and inner surfaces.
Cortical Thickness (Fischl and Dale, 2000 )
Improvement in motor skills or phonological processing results in thinning or thickening of dedicated brain regions Complexity of developmental trajectories throughout the cerebral cortex Lu, L. et al. Cereb. Cortex 2007 Shaw, P. et al. J. Neurosci. 2008
Cortical Thickness cons • Uncorrected measurements due to mis-registration of the two surfaces (outer and inner) • Possible misclassification of GM/WM tissue (Partial volume effects) due to the low resolution of MRI • Cortical thinning could be not entirely due to reduction in size or number of neuronal cell bodies or their synaptic processes, but also in part due to an increase in the myelin coating of fibers (Sowell et al. 2007) i.e. axons look like gray matter until they are myelinated, so measured gray matter decreases are observed in part as a result of myelination
Diffusion Tensor Imaging by tracking the motion of water along the white matter fibers, gives a measure of the structural connectivity between brain regions
Diffusion Tensor Imaging isotropic anisotropic Shows the path of less resistance of water diffusion. This allows to reconstruct the pathway of the underlying fibre Change in Fractional Anysotropy (FA - directionality of the water) or Mean diffusion (MD) are indicator of funcionally relevant variation in the pathway
Diffusion Tensor Imaging Connectivity-based segregation of the human striatum predicts personality characteristics Cohen et al. 2008, Nature
DTI cons • Due to the low resolution of MRI images, the method is not efficient in region were there is high complexity or fibre crossing • Not possible to differentiate anterograde or retrogade connections • Inference only at macroscopic level • The presence or absence of any pathway should be interpreted with care