2. Problem Solving Tools
2. Problem Solving Tools. Systematic Procedures for “PSK&E”. Identify problem Collect data Analyze data Develop alternative solutions Select a solution Install solution Follow up. Problem Identification. Tools: - Pareto analysis - Fishbone diagram - Gantt chart

2. Problem Solving Tools
E N D
Presentation Transcript
Systematic Procedures for “PSK&E” • Identify problem • Collect data • Analyze data • Develop alternative solutions • Select a solution • Install solution • Follow up
Problem Identification Tools: - Pareto analysis - Fishbone diagram - Gantt chart - PERT charting Examples: • Product with low profit • Bottleneck operations • Workers complaints
Recording Tools • Operation Process Chart (OPC) • Flow Process Chart • Flow Diagram • Gang Process Charts • Worker and Machine Process Charts • The Two-hand Process Chart
Analysis Tools • 5 Why • Why is this operation necessary? • Why is this operation performed in this manner? • … • 4W + 1H • How can the operation be performed better? • Who can best perform the operation? • Where could … • When … • Why …
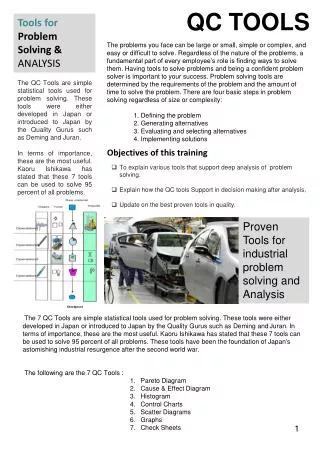
7 Tools • Check sheets • Histograms • Pareto diagrams • Cause and effect diagrams • Graphs • Scatter diagrams • Line graphs
7 New Tools • Affinity Diagrams • Relations Diagrams • Tree Diagrams • Process Decision Program (PDP) Charts • Matrix Diagrams • Prioritization Matrices • Arrow Diagrams
7 Waste • Waste from overproduction • Waste from waiting times • Waste from transportation and handling • Waste related to useless and excess inventories • Waste in production process • Useless motions • Waste from scrap and defects