Download
1 / 12
120 likes | 285 Views
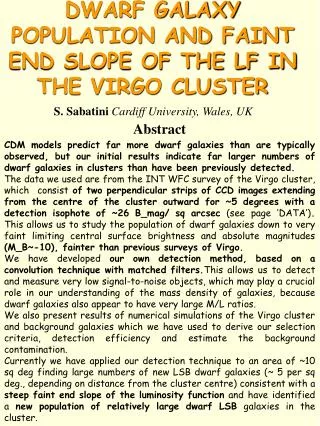
DWARF GALAXY POPULATION AND FAINT END SLOPE OF THE LF IN THE VIRGO CLUSTER. S. Sabatini Cardiff University, Wales, UK. Abstract

E N D
DWARF GALAXY POPULATION AND FAINT END SLOPE OF THE LF IN THE VIRGO CLUSTER S. SabatiniCardiff University, Wales, UK Abstract CDM models predict far more dwarf galaxies than are typically observed, but our initial results indicate far larger numbers of dwarf galaxies in clusters than have been previously detected. The data we used are from the INT WFC survey of the Virgo cluster, which consist of two perpendicular strips of CCD images extending from the centre of the cluster outward for ~5 degrees with a detection isophote of ~26 B_mag/ sq arcsec (see page ‘DATA’). This allows us to study the population of dwarf galaxies down to very faint limiting central surface brightness and absolute magnitudes (M_B~-10), fainter than previous surveys of Virgo. We have developed our own detection method, based on a convolution technique with matched filters.This allows us to detect and measure very low signal-to-noise objects, which may play a crucial role in our understanding of the mass density of galaxies, because dwarf galaxies also appear to have very large M/L ratios. We also present results of numerical simulations of the Virgo cluster and background galaxies which we have used to derive our selection criteria, detection efficiency and estimate the background contamination. Currently we have applied our detection technique to an area of ~10 sq deg finding large numbers of new LSB dwarf galaxies (~ 5 per sq deg., depending on distance from the cluster centre) consistent with a steep faint end slope of the luminosity function and have identified a new population of relatively large dwarf LSB galaxies in the cluster.
DWARF GALAXY POPULATION AND FAINT END SLOPE OF THE LF IN THE VIRGO CLUSTER Sabatini S., Davies J., Smith R., Linder S., Roberts S.,Cardiff University, Wales, UK Abstract CDM models predict far more dwarf galaxies than are typically observed, but our initial results indicate far larger numbers of dwarf galaxies in clusters than have been previously detected. The data we used are from the INT WFC survey of the Virgo cluster, which consist of two perpendicular strips of CCD images extending from the centre of the cluster outward for ~5 degrees with a detection isophote of ~26 B_mag/ sq arcsec (see page ‘DATA’). This allows us to study the population of dwarf galaxies down to very faint limiting central surface brightness and absolute magnitudes (M_B~-10), fainter than previous surveys of Virgo. We have developed our own detection method, based on a convolution technique with matched filters.This allows us to detect and measure very low signal-to-noise objects, which may play a crucial role in our understanding of the mass density of galaxies, because dwarf galaxies also appear to have very large M/L ratios. We also present results of numerical simulations of the Virgo cluster and background galaxies which we have used to derive our selection criteria, detection efficiency and estimate the background contamination. Currently we have applied our detection technique to an area of ~10 sq deg finding large numbers of new LSB dwarf galaxies (~ 5 per sq deg., depending on distance from the cluster centre) consistent with a steep faint end slope of the luminosity function and have identified a new population of relatively large dwarf LSB galaxies in the cluster.
Numerical simulations of the background contamination 10 degrees Z=0 Z=1.0 The best selection criteria to maximize membership are estimated using numerical simulations for Virgo and background galaxies of a cone universe. The input galaxy creation has been made using the following parameters: • COSMOLOGY: • LF: • SB DISTRIBUTION: • Galaxies PROFILES: M= 0.3, = 0.7 BG =-1.19,VIRGO =-1.0to-2.0 (In steps of 0.2) (SDSS) SB-M relations (Driver; Ferguson) Exponential profile THE OUTPUT IS A CATALOGUE WITH PHOTOMETRIC PROPERTIES OF EACH GALAXY We can then analyse these properties in order to find the best selection criteria: the one that maximizes Virgo members and minimizes background contamination.
Completeness & Contamination: results from the simulations Histogram of galaxies present in each bin of scale length: filled line is background galaxies and dotted line is Virgo members. The results depend on the LF assumed for the cluster. For a slope of -1.4 (Sandage, 1984), these are completeness and contaminations for different selection criteria, based on a minimum scale length cutoff: Scale length (arcsec) SELECTED GALAXIES in OUR SAMPLE: SCALE LENGTH 3” NB: The STEEPER the SLOPE of the cluster LF, the smaller the contamination by background galaxies.
Our detection algorithm Searching for galaxies with a surface brightness close to the sky noise level requires image enhancement techniques. The algorithm we developed (Sabatini et al., 1999) is optimized for detection of LSB galaxies and consists of the following steps: - background fluctuations reduction and removal of stars, cosmic rays, bright galaxies. - image convolution with purposely designed filters, enhancing faint and diffuse structures. - classification and measurement of the objects detected in this way As an example to illustrate the algorithm performance, we added 4 artificial galaxies to a real image with a flux very close to the sky noise (positions are showed in the bottom left figure). After the convolution with our matched filters (bottom right figure), these very low signal-to-noise objects are clearly visible and easily detectable and are the only ones left on the image. We use this final image to detect the position of the objects and measure their total magnitude (=flux peak).
Detection & Classification Efficiency In order to determine the detection and classification efficiency of our automated method we carried out simulations with artificialgalaxies added on real images. On the left we plot the Detection efficiency as a function of scale length (arcsec) and Central Surface Brightness (multiples of sky noise). It ranges between 90%-100% over the main part of the dwarf galaxy region: (, 0) = (10, 10sky) = (10,23.6) ---> M = -14.5 (, 0) = (3, 3sky) = (3, 25.0) --->M= -10.3 Classification efficiency for total magnitude recovery. We plot here the difference between the measured magnitude and the input one of simulated galaxies with different central surface brightness (again measured as multiples of sky) .
DATA The data consist of two perpendicular strips of CCD images extending from the centre of the cluster outward for ~5 degrees with a sky noise of ~26 B_mag/ sq arcsec. Our first results are based on the analysis of the horizontal strip: 11.2 sq degrees During the last run of observations at the INT (March 2002) we extended the strip for 2 more degrees to be sure of having reached the edge of the cluster.
We have compared our catalog of very low surface brightness galaxies with previous ones (VCC, IBM, Trentham) and we find a total of 144 new extended LSB galaxies that haven’t been previously accounted for. Here are few examples: NEW OBJECTS • CSB= 25.0 Bm • =7 arcsec M=-12.2 • CSB= 25.3 Bm • =5 arcsec M=-11.2 • CSB= 25.7 Bm • =7 arcsec M=-11.5
NUMBER DENSITY PROFILE & LUMINOSITY FUNCTION Membership of the cluster has been quantified using our numerical simulations. As a further test, we plot here the surface number density of our detections as a function of the distance from the cluster centre (M87). The Luminosity Function obtained from our automated detections is a steep one (a= -2.2). This value is comparable with that obtained by Phillipps et al (1998). Log N (no per 11.2 sq deg) MB
FURTHER WORK • In our last run at the INT (March 2002) we extended the horizontal strip for 2 degrees in order to have a better understanding of the background population close to the Cluster and we will soon run our detection algorithm on these new data. • We have data in B band and I band for both strips. Our aim is to study the properties and colours for the galaxies we detect, their dependence with the position in the cluster and the difference with galaxies in the field ( see extension of horizontal strip). • We also have an HI cube of the cluster and we plan to run an automatic detection algorithm on it. We will then compare properties of Hi rich galaxies with the ones detected in optical, study the HI contribution of the galaxies in our optical catalog and eventually compute a mass function for the cluster. • More generally our aim is to study in much more detail the properties of dwarf galaxies in different environments: the Fornax cluster (Kambas et al.,,2000), the Ursa Major Cluster and the field (Millennium strip, equatorial strip across filaments and voids (Roberts et al., in prep); around giant galaxies (Smith et al., in prep.)).
CONCLUSIONS • In this poster we have presented a new algorithm optimised for the detection of very low signal-to-noise galaxies. • The advantages of a completely automated procedure are the easy management of wide imaging data, the repeatability of the procedure and the objective selection. • From the simulations we did using artificial galaxies added to real images we are also able to systematically quantify the completeness of our sample for each different bin of scale length and CSB. • Our deep data have allowed us to study the population of dwarf galaxies down to very faint CSB and absolute magnitudes, (fainter than previous survey of Virgo). Our catalog contains 144 new extended LSBG. • We obtain a steep faint end slope for the LF, that is in agreement with that suggested by Impey & Bothun (1988) and that found by Phillipps et al (1999) for the Virgo cluster. This may play a crucial role in our understanding of the mass density of galaxies (Davies et al., 2002). REFERENCES • Sandage, Binggeli et al., 1985, ApJ • Impey, Bothun at al, 1988, ApJ • Ferguson, Binggeli et al., 1994, AARv • Phillipps, Schwrtzenberg et al., 1998 ApJ • Sabatini, Scaramella et al., 1999, SAIt proceedings • Kambas, Davies et al., 2000, AJ • Madgwick et al., 2001, MNRAS • Trentham et al., 2002, astro-ph/0202437 v1 • Davies et al., 2002, sub. to MNRAS
DWARF GALAXY POPULATION AND FAINT END SLOPE OF THE LF IN THE VIRGO CLUSTER two perpendicular strips of CCD images extending from the centre of the cluster outward for ~5 degrees with a sky noise of ~26 B_mag/ sq arcsec, total area of 11.2 sq degrees + Automated detection algorithm As check for membership of our detections, we have plotted here the surface number density. The Luminosity Function obtained from our automated detections is a steep one (a= -2.2).