Download
1 / 83
830 likes | 904 Views
Gain deeper insight into data analysis, explore SMART2 web application, identify strengths/issues, develop leadership strategies. Understand accountability, inquire principles, and actionable knowledge to improve student outcomes through data utilization.

E N D
Working with SMART2 Workshop for leaders in the use of SMART2 Workshop presentation 20/09/2010 Andrew Fraser and Carmel Kriz
Objectives Gain greater understanding of using data from an inquiry frame of reference Develop greater familiarity with the SMART2 web-based application Undertake an initial analysis of school SMART2 data Identify strengths and issues to explore further Develop strategies for effective leadership in the analysis and use of information
Data Matters Leading learning with an inquiry habit of mind
Setting the context A climate of accountability
Using data to learn What comes to mind when you hear the word: DATA (60 seconds)
Using data to learn What comes to mind when you hear the word: INFORMATION (60 seconds)
A commitment to action (p. 16) Schools need reliable, rich data on the performance of their students because they have the primary accountability for improving student outcomes. Good quality data supports each school to improve outcomes for all of the students.
What is Accountability? Earl and LeMahieu, 1997 As cited in “Leading learning in a data-rich world” Earl and Katz (2006: 10) Accountability is the conversation about what the information means and how it fits with everything else that we know and about how to use it to make positive changes
Opening up productive inquiry Some principles
Internal motivation: Teachers improve through learning their craft, which happens best in PLCs which have access to valid data about achievement. Professional Learning Communities Inquiry Habit of Mind Questions Requires imagination What happens? Data: the divide… The underlying assumptions Judgment External motivation: Teachers are motivated to improve by the idea that someone is watching over them, judging and visiting consequences on them if the targets aren’t met. Thanks to John DeCourcey
The data, used well, frame the right questions;Used poorly, they rush to judgment
Data worth looking at: “The value of the data emerges only when analysis provides insights that direct decisions for students.” Stephen White, Beyond the Numbers, 2005
From Data to Professional Knowledge • Data are • Making useful information • Developing informed professional knowledge
Data Information Knowledge • Types of Data • Outcome • Demographic • Process • Perceptual Information Actionable knowledge • Types of Decisions • To identify or clarify a problem • Set and monitor progress towards goals • Address individual and group needs • Monitor and evaluate practices • Validate proposals for change • Assess whether student needs are being met • Strategically allocate resources • Adapt a new practice to fit the situation
Collaboration “Data analysis is a team sport.” Doug Reeves • Develops team thinking • Promotes insights that numbers alone can’t produce • Provides a forum for legitimizing practice • A characteristic of “Schools that Learn”
Evidence: What does this indicate? Construct: Top mark in the class, student has been studying well, highly motivated… Wonderful learning? Lowest he’s ever achieved, no sign of any preparation, smart student, easy test He scored 42/60 on the midyear test Lazy? Whole class is showing improvement, class average is better than ever gained before… Superb teaching? Almost any evidence can be an indicator of many different constructs – finding the most productive questions is the art of data analysis. Stole the answer sheet from the teacher’s desk the day before… Dreadful cheat? Thanks to John DeCourcey
Use it to ask the right questions Test the ‘Strength’ of the evidence: is it a sound link to the construct? ‘Triangulate’ the construct – what other way do I have of looking at it? Using data well Decide on a direction – go top-down, or bottom-up Slice the data different ways: mean, top, bottom, time, individual map Be suspicious of yourself: ask the next question Thanks to John DeCourcey
Three Principles of Data Analysis • Exploring and determining the antecedents for success • Collaborating with colleagues • Embracing Accountability - Learning from our data
Connecting Cause and Effect Data at the program/initiative level
Some questions for consideration • “What does this ask us about how teaching and learning are going in our school?” • “What do we need to do about it?” • “What do we need to learn?”
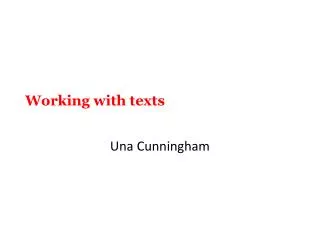
Achievement Scale Each Year level Student Report shows 6 of the bands. Year 9 Reports show bands 5 to 10 Year 7 Reports show bands 4 to 9 Year 5 Reports show bands 3 to 8 Year 3 Reports show bands 1 to 6 Band 10 Band 9 Band 8 Year 9 Band 7 Year 7 Band 6 Year 5 Band 5 Band 4 Year 3 Band 3 Band 2 Band 1
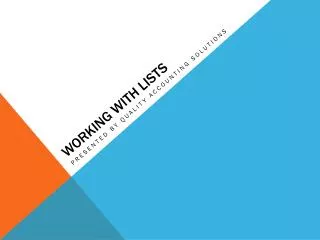
Achievement Bands Band 10 Band 9 Band 9 Band 8 Band 8 Band 8 Band 7 Band 7 Band 7 Band 6 Band 6 Band 6 Band 5 Band 5 Band 4 Band 3 Students working at proficiency would be in the top 2 achievement bands for the respective year level. Students are proficient Year 9 Year 7 Year 5 Students working at minimum standard would be in the second lowest band. Year 3 Students that are in Band 1 are deemed at operating at below minimum standard. Band 6 Band 5 Band 5 Band 4 Band 4 Band 3 Band 2 Students are at the national minimum standard Band 1 Students are below the national minimum standard
NAPLAN Scales There are five separate national scales, one each for: Reading Writing Spelling, Grammar/Punctuation and Numeracy. Note: There are no more benchmarks. Students that are in the lowest band are deemed to be operating below minimum standard.
1 8 2 3 7 4 5 6
Using Means and Standard Deviations Good starting point Gives overall school performance Helps frame questions for further investigation Gives difference in mean between the school and the state Can be found in Means &Standard Deviations Question : How significant is the difference from the state????
Means and Standard Deviations When student numbers are small, summaries based on mean (average) scores can be misleading. In small groups, means can be affected by a couple of high performing or low performing students. Means sometimes obscure real differences within a group, even when the numbers are large. For example, a school with concentrations of both educationally advantaged and disadvantaged students may find that the school mean actually describes very few of its students. For schools with year cohorts less than 5 students no school means and deviations will be displayed.
Means and Standard DeviationsSchool Reports Select aspect – Reading or Numeracy Compare the mean for the full cohort against the state mean Compare full cohort with boys, girls, ATSI Compare means in different strands of literacy (writing, reading etc) or numeracy (number, measurement )
Significance of difference in means School mean – state mean, divided by the state SD. This calculation is about substantive meaning of any difference. It is not a test of statistical difference.
Significance of difference in means Rule of thumb method : > 0.5 Well above state 0.5 > 0.2 Above state 0.2 > -0.2 Within state -0.2 > -0.5 Below state < -0.5 Well below state
Further investigations Is the Significant difference of the mean: Because of the results of a particular group? Eg.boys, girls Because of the results of a particular class? Eg. class group that has had 4 different teachers in one year The same for both year levels (3 & 5, 7 & 9)? Has this been the pattern in previous years?
Means and Standard Deviations Significant difference of the mean allows for comparison between year levels Means and Standard Deviations allow for creation of means table for special groups Means and Standard Deviations allow for comparison with school groups
Percentage in Bands Choose Percentages in Bands from main menu. View for full cohort, boys, girls, ATSI, or custom groups Record bands where difference from the state is significant. * less students in top band or top two bands * more students in the bottom band (below National Minimum Standard) * more students in the second bottom band (at the National Minimum Standard) OR of course the reverse
Further Investigations Check to see if there is there is a significant difference in performance between the strands e.g. In Literacy - between writing and reading In Numeracy - between Number/Patterns & Algebra and Data/ Measurement /Space and Geometry More detailed investigation can be carried out through the Item Analysis. Questions need to be asked re pedagogy in these areas – this could form part of the School Improvement Plan.
Percentage in Bands Record names of students in the bottom two bands Create a group of these students. (Create /Edit and Delete Groups) Go to Item Analysis to look at which items all this group have correct /incorrect
Percentage in Bands Check names of students in particular bands. Are there any surprises? Follow up responses of individual students whose band placement is of concern by going to Student Analysis
Value added Percentages in Bands may be of use for schools where they have tried to increase the movement of students into higher bands. Care must be taken when using this information with schools who have less than 10 students. In schools with small numbers each individual student is worth a large percentage and this may impact greatly on the student numbers in a band.