Download
1 / 59
590 likes | 681 Views
National teleconference to clarify APR data analysis, reporting instructions, and state-by-state reporting for Indicator 3. Presented by NCEO experts with helpful tools.

E N D
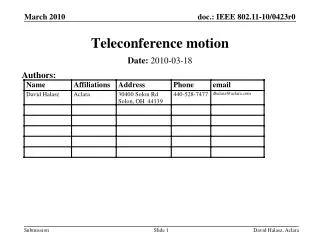
NCEO Indicator 3 Teleconference DATE: Tuesday, November 25, 2008 TIME: 10:00 Pacific, 11:00 Mountain, 12:00 Central, 1:00 Eastern Presenters Facilitator: Anne Chartrand, Southeast RRC Jason Altman, NCEO Chris Bremer, NCEO Christopher Rogers, NCEO
Call Purposes • To enhance understanding of the meaning behind the APR reports and what information is needed to properly analyze them • To provide state personnel with clarified instructions on how to properly complete the data analysis behind the Indicator • To enhance state by state APR reporting similarity • To clarify the similarities and differences between the APR and Table 6 sets of data and to show shortcuts between the two sets (including the use of a new tool developed by NCEO) • To address Improvement Activities for Indicator 3
Call Materials • Posted at http://cehd.umn.edu/nceo/indicator3/Indicator3NationalCall.html • Have your own Table 6 data from your 618 report available • Have a copy of your improvement activities available
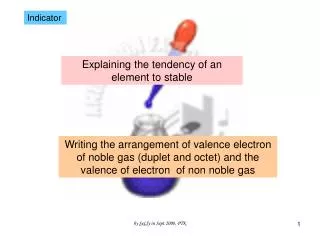
Who are we? • We provide national technical assistance in: • The participation of students with disabilities in national and state assessments • State standards-setting efforts • State graduation requirements • http://www.nceo.info NCEO has been responsible for Indicator 3 analysis going back to State Performance Plan submission
APR and Table 6 of 618 – Trail of History APR 03-04 (looks a lot like Table 6) SPP 04-05 (new format) 04-05 Table 6 SEPARATE APR 05-06 through 07-08 Table 6 attached! X
Why Is This Important? • Table 6 provides the backbone to APR Indicator 3 (Most states fill out their Section 618 report first) • OSEP needs the data from both these sources so that it has a clear picture of the assessment of SWDs across states • National summary by content, type of assessment, and grade is important
What do the data tell us? We know how difficult your job as data managers can be!!!
APR Instructions – 2007-08 • AYP • # of districts meeting the State’s AYP objectives for progress for the disability subgroup divided by the total # of districts meeting minimum “n” size • Participation • Sub-indicators for Regular Assessment (both with and without accommodations), and Alternate Assessment (both AA-GLAS, and AA-AAS) • Performance • Sub-indicators for Regular Assessment (both with and without accommodations), and Alternate Assessment (both AA-GLAS, and AA-AAS)
Indicator 3A - AYP • This number is intended to show the percentage of districts in your state that are making Adequate Yearly Progress • To do this, districts must meet AYP for both Math AND Reading • AYP DATA BY CONTENT AREA DO NOT GIVE A CLEAR PICTURE WITHOUT AN OVERALL NUMBER • Proper Calculation on following page
Indicator 3A - AYP • Example calculation – State XYZ has had 32 districts meet AYP for Math, and 28 districts meet AYP for Reading • ONLY 14 districts made AYP for BOTH Math and Reading • State XYZ had 50 districts meet the minimum “n” size • Calculation = districts meet AYP / total “n” districts • = 14 / 50 • = 28% overall • NOTICE – THIS NUMBER IS LESS THAN OR EQUAL TO THE MATH OR READING CONTENT AREA ONLY CALCULATION
Indicator 3A - AYP • Included below is the outline for an example table • This table allows for states to highlight successes • At the same time this table displays all necessary information
Assessment Data From: 618: Table 6 To: APR Indicator 3 NCEO Indicator 3 Tool To be used for lifting assessment data from Section 618: Table 6 reports Altman, J. R., Bremer, C., Vang, M., Thurlow, M., & Rogers, C. (2008)
Table 6: What is it? • Table 6 is included in the section 618 report • Table 6 must be submitted w/ APR in February • It looks something like this (broken up into worksheets in excel):
Indicator 3B - Participation • Calculations: • a. # of children with IEPs in assessed grades • b. # of children with IEPs in regular assessment with no accommodations • c. # of children with IEPs in regular assessment with accommodations • d. # of children with IEPs in alternate assessment against grade level achievement standards • e. # of children with IEPs in alternate assessment against alternate achievement standards • Account for any children included in “a” but not included in “b, c, d, or e” above.
Annual Performance Report: Indicator 3 • The entire APR Indicator 3 participation table can be created using 618: Table 6 Data!!!! • In the example to come Table 6 location is listed in each APR cell in the following format: • (Column) : (Grade)
Annual Performance Report: Indicator 3 618: Column 1 Grade 3 618: Column 8 Grade 4
Indicator 3 Child Count Data 618: Table 6 Test Data
Indicator 3 Regular Assessment Data 618: Table 6 IEPs in regular assessment with no accommodations equal to BLUE minus GREEN
Indicator 3 Regular Assessment Data 618: Table 6
Indicator 3 618: Table 6
Indicator 3 Alternate Assessment Data 618: Table 6
Indicator 3 Alternate Assessment Data 618: Table 6
Indicator 3 618: Table 6
Indicator 3 Alternate Assessment Data 618: Table 6
Indicator 3 Overall Calculations Overall equal to Blue + Green + Red + Yellow + Violet
Indicator 3 Overall Calculations Overall % equal to Blue divided by Green and then multiplied by 100
Indicator 3 Non-Participant Data 618: Table 6
Annual Performance Report: Indicator 3 Overall Row Total equal to Blue + Green + Red + Yellow + Violet + Orange + Pink (same is true for all cells in this COLUMN)
Annual Performance Report: Indicator 3 Overall % equal to Blue divided by Green and then multiplied by 100 (same is true for all cells in this COLUMN)
Indicator 3C - Performance • Calculations: • a. # of children with IEPs in assessed grades • b. # of children with IEPs proficient or above in regular assessment with no accommodations • c. # of children with IEPs proficient or above in regular assessment with accommodations • d. # of children with IEPs proficient or above in alternate assessment against grade level achievement standards • e. # of children with IEPs proficient or above in alternate assessment against alternate achievement standards • REMEMBER – Raw numbers are VITAL!!!
Annual Performance Report: Indicator 3 • Most of the APR Indicator 3 performance table can be created using 618: Table 6 Data!!!! • In the example to come Table 6 location is listed in the following format: • (Column) : (Grade)
618: Column 1 Grade 3 Annual Performance Report: Indicator 3 618: Proficient Levels Table 9d Grade 6
Indicator 3 Child Count Data 618: Table 6
Regular Assessment Data Indicator 3 618: Table 6 Not Available on 618: Table 6
Regular Assessment Data Indicator 3 For IEPs in regular assessment with no accommodations sum columns shaded below then take that result and subtract Green 618: Table 6 Example of state with minimum proficient level of 3
Alternate Assessment Data Indicator 3 618: Table 6 For IEPs in AA-GLAAS sum columns shaded above starting with minimum proficient level and moving right Example of state with minimum proficient level of 2
Alternate Assessment Data Indicator 3 618: Table 6 For IEPs in AA-MAAS sum columns shaded above starting with minimum proficient level and moving right Example of state with minimum proficient level of 2
Indicator 3 Alternate Assessment Data 618: Table 6 For IEPs in AA-AAAS sum columns shaded above starting with minimum proficient level and moving right Example of state with minimum proficient level of 4
Indicator 3 Overall Calculations Overall equal to Blue + Green + Red + Yellow + Violet
Indicator 3 Overall Calculations Overall % equal to Blue divided by Green and then multiplied by 100
Annual Performance Report: Indicator 3 Overall Row Total equal to Blue + Green + Red + Yellow + Violet + Orange + Pink (same is true for all cells in this COLUMN)
Annual Performance Report: Indicator 3 Overall % equal to Blue divided by Green and then multiplied by 100 (same is true for all cells in this COLUMN)
Improvement Activities (IAs): Categories A-J • Improve data collection and reporting • Improve systems administration and monitoring • Provide training/professional development • Provide technical assistance • Clarify/examine/develop policies and procedures • Program development • Collaboration/coordination • Evaluation • Increase/adjust Full Time Equivalent • Other