Download
1 / 17
170 likes | 311 Views
How large-scale barcoding promotes large-scale biodiversity assessment. Dan Faith The Australian Museum http://www.amonline.net.au/systematics/ Andrew Baker Queensland University of Technology, Australia and Steffen Klaere, Bui Quang Minh, Arndt von Haeseler

E N D
How large-scale barcoding promotes large-scale biodiversity assessment Dan Faith The Australian Museum http://www.amonline.net.au/systematics/ Andrew Baker Queensland University of Technology, Australia and Steffen Klaere, Bui Quang Minh, Arndt von Haeseler MFPL - Center for Integrative Bioinformatics, Vienna, Austria
Key points • Biodiversity assessments and monitoring linked to climate change impacts, the 2010 biodiversity target, need to address overall biodiversity • We need information for many taxa and many places, + modeling for biodiversity surrogates • We can use the approximate phylogenetic information from DNA barcoding and “PD” • This side-steps species designations • Congruent PD patterns boost predictions of overall biodiversity • Output trees (NEWICK) from BOLD can link to new PD web-based software
Systematic conservation planning and the 2010 target – can DNA barcoding provide the needed biodiversity information?
PD complementarity:additional PD2 units for area offering species { a, b, c } 6 units for area offering species { i, k, m }
Lots of cryptic variation; lots of geographic clustering – e.g. Nepean vs. Georges rivers Schematic tree shows PD complementarity for Georges in red Consider implications of loss of fauna from human impacts on Nepean (next slide) Faith, D. P and A. Baker, 2006. Phylogenetic diversity (PD) and biodiversity conservation: some bioinformatics challenges” Evolutionary Bioinformatics Online 2 http://www.la-press.com/cr_data/files/f_EBO-2-Faith-et-al_174.pdf
This PD-complementarity pattern is identical for different taxa
Web-based PD analyses to be linked to BOLD http://www.cibiv.at/software/pda/ Current capabilities – use NEWICK input, evaluates PD of user-defined sets of taxa new capabilities – calculate potential gains/losses in PD and link to systematic conservation planning methods
BOLD data and the 2010 biodiversity target systematic planning, optimized, loss of sites - this is BETTER Random loss of sites – this is BAD Faith, DP (2006) Taxonomic research and 2010. http://www.edinburgh.ceh.ac.uk/biota/Archive_2010target/8418.htm
GBIF for 2010 GBIF data serving the 2010 biodiversity target
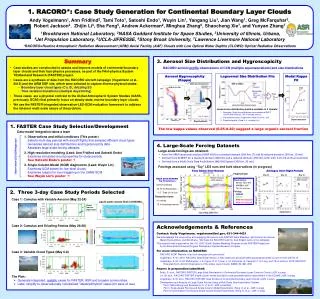
Key Sydney A B C D E Georges R Baker et al Nepean R L Burragorang Woronora R COI Lineage distributions Euastacus Nattai R Wingecarribee R Upper Georges 20 km Upper Nepean Shoalhaven R AUSTRALIA Refer Detail
Key Sydney A B C D E Georges R Baker et al Nepean R L Burragorang Woronora R Lineage distributions Euastacus Nattai R Wingecarribee R 20 km localities already impacted or under threat from mining and/or future dams Shoalhaven R AUSTRALIA Refer Detail
Key Sydney A B C D E Georges R Baker et al Nepean R L Burragorang Woronora R Lineage distributions Euastacus Nattai R Wingecarribee R Higher priority for conservation 20 km Shoalhaven R AUSTRALIA Refer Detail
Large or small impacts of climate change on PD? fortunately did not find this - large loss of PD or evolutionary potential for given species loss small loss of PD for given amount of species loss the secure species (red) were phylogenetically dispersed red = surviving evolutionary potential Yesson, C. and A. Culham. (2006) A phyloclimatic study of Cyclamen. BMC Evolutionary Biology 6:72