Download
1 / 25
250 likes | 416 Views
Data ‘R’ Us Making Good Use of Your Data. Session 3 Stats 101: What Can You Do With the Data You Have (We Promise This Will Be Painless!) August 15, 2011 Kimberly S. Maier, Ph.D. Measurement and Quantitative Methods Program Michigan State University

E N D
Data ‘R’ Us Making Good Use of Your Data Session 3 Stats 101: What Can You Do With the Data You Have (We Promise This Will Be Painless!) August 15, 2011 Kimberly S. Maier, Ph.D. Measurement and Quantitative Methods Program Michigan State University This webinar series is sponsored by the Region 10 Technical Assistance and Continuing Education (TACE) Center through funding provided from the Rehabilitation Services Administration.
Agenda • The basic concepts you need to know (What is alpha, significance, power, error rate, generalizability and other confusing terms?) • Descriptive Statistics (Frequencies, crosstabs, means, standard deviations, etc.) • Group comparisons (t-tests, ANOVA) • Tests of association (chi-square, correlation)
Evidence for Evaluation • As discussed by Dr. Pi in the first presentation in this series, “…the purpose of an evaluation is to provide useful information for decision-making to a variety of stakeholders.” • This information can be provided by statistical techniques, which can be used to: • Summarize the data: describe • Model the data: examine differences or relationships
Type of Information Statistical Analysis Can Provide • Describe the participants in a program • Describe the nature of the outcome variables (e.g., satisfaction, achievement, success or not on a criteria) • Determine if groups of participants differ on an outcome variable. • Determine if there is a relationship between participant characteristics and an outcome variable. • Determine if the participants changed from the beginning to the end of the program.
Information Types • What is the age distribution of the clients? • What services do the clients receive? • Are younger clients over-represented? • Did the clients receiving one service benefit more than clients receiving another service?)
How Do You Pick the Right Method? • Statistical techniques are chosen on the basis of the measurement level of your variable/s (regardless of whether you’re summarizing or modeling). • Categorical variable: Measures that are made by placing observations into mutually exclusive and exhaustive categories • ordinal variable: ordered categories (e.g., number of services) • nominal variable: unordered categories (e.g., race) • Continuous variable: Measures that are made by positioning observations on a linear continuum (e.g., annual income)
OperationalizationMethod Remember this? • In the second presentation of this series, Dr. Thielsentalked about the importance of operationalization. • The third component, Measurement Procedures, has implications for the choice of statistical techniques. • A small number of transformations are possible: • Continuous variables can be transformed to ordinal variables • Categories of nominal or ordinal variables can be combined.
Summaries for Categorical Data • Graphical summaries: • Pie chart • Bar chart • Numerical summaries: • Frequency table • Contingency table • Numerical summaries limited to ordinal variables (because the order of the values must be meaningful): • Mean • Mode • Median • Range (minimum, maximum values) Measures of Central Tendency Measure of Variability
Summaries for Continuous Data • Graphical summaries: • Histogram • Boxplot • Scatterplot (relationship between two variables) • Numerical summaries: • Mean • Mode • Median • Range (minimum, maximum values) • Standard deviation • Variance • Quartiles • Skew • Kurtosis Measures of Central Tendency Measures of Variability Measures of the shape of the value distribution
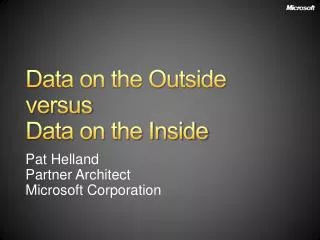
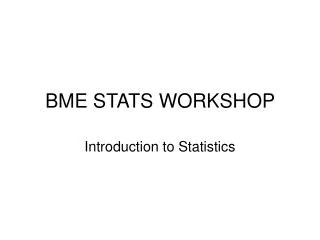
Case in point: Summary • Suppose you are interested in summarizing the racial characteristics of your client load. • You decide to operationalize ‘Race’ according to clients’ self-reported responses to an item asking them to indicate which of seven racial groups they best identify with. • The measurement level of this variable is categorical : Measures that are made by placing observations into mutually exclusive and exhaustive categories. • Furthermore, the variable is nominalbecause the categories are unordered categories. • The nature of the variable suggests several different options for summarizing the data.
Case in point: Summary Pie Chart - Race
Case in point: Summary Bar Chart
Case in point: Summary Frequency Table
Modeling Data • This technique involves hypothesis testing or creating confidence intervals. • Modeling data involves the ideas of: • Generalizability • Alpha • Power • Significance
Modeling Data • Determine whether you need to generalize beyond the sample at hand to a population. • Sampling becomes very important in this instance • Population must be specifically defined. • Determine how many people you’ll need in the study. • You need to specify power level (usually .80), alpha (usually two-tailed .05), and effect size to compute required sample size. • Specifying an effect size can be tricky (you haven’t done the study yet!) but you can rely on previous research or at the very least Cohen’s rules of thumb.
Let’s talk about those confusing terms… • Generalizability dictates sampling design
Let’s talk about those confusing terms… • The researcher chooses a, which dictates required sample size, given a level of power and an effect size
Let’s talk about those confusing terms… • The researcher chooses power, which dictates sample size, given an expected effect size and a
Let’s talk about those confusing terms… • Significance is a calculated according to the statistical model chosen, and is compared to a; if something is statistically significant, that implies that the significance was less than a.
Let’s talk about those confusing terms… • ES is calculated according to the statistical model chosen, and dictates power.
What Do You Want to Know? If you want to: Use this test:
What Do You Want to Know? If you want to: Use this test:
A Few Useful Print Resources Creswell, J. (2008). Research Design: Qualitative, Quantitative, and Mixed Methods Approaches. Sage. Field, Andy (2009). Discovering Statistics. Thousand Oaks, CA: Sage. Huck, S. (2011). Reading Statistics and Research (6th ed.). Addison Wesley. Nicol, A. and Pexman, P. (2010). Presenting Your Findings: A Practical Guide (6th ed.). American Psychological Association. Shadish, W. Cook, T., and Campbell, D. (2001). Experimental and Quasi-Experimental Design. Wadsworth Publishing.
A Few Useful Web Resources • Garson’s Statnotes website: http://faculty.chass.ncsu.edu/garson/PA765/statnote.htm • Rice Virtual Lab in Statistics (see Hyperstat Online): http://onlinestatbook.com/rvls.html • UCLA Statistical Computing: http://www.ats.ucla.edu/stat/ • Online Statistics Education: http://onlinestatbook.com/2/index.html