Download

1 / 54
540 likes | 656 Views
Chapter two focuses on essential science skills, particularly measuring mass and volume, defining density, and the graphical representation of data. It explains the distinction between mass and weight, details on measuring volume, and methods to calculate density for solids and liquids. The chapter guides through practical investigations like measuring mass and volume, exploring the density of materials, and utilizing graphs to visualize data and trends. By the end of this chapter, learners will develop a clear understanding of these fundamental science concepts and their applications.

E N D
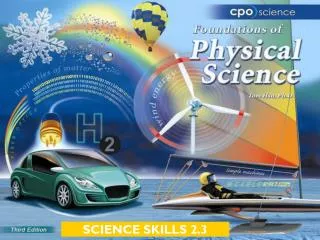
Chapter Two: Science Skills • 2.1 Mass and Volume • 2.2 Density • 2.3 Graphing • 2.4 Solving Problems
Section 2.1 Learning Goals • Explain the meaning of mass and describe the units for measuring mass. • Distinguish between mass and weight. • Define volume and explain how the volume of matter is measured.
Key Question: How do you measure mass and volume? Investigation 2A Measuring Mass and Volume
2.1 Measuring mass • Mass describes the amount of matterin an object. • The SI unit for mass is the kilogram (kg). • The kilogram is too large a unit to be convenient for small masses. One gram (g) is one-thousandth of a kilogram. What is the estimated mass of ONE zinc nut?
2.1 Matter • Matter is anything that has mass and takes up space. • All matter has mass. • Steel, plastic, rubber, and glass are different kinds of matter. A car has a lot more of each kind of matter than a bike.
2.1 Mass and weight are different • We tend to use the terms mass and weight interchangeably, but they are not the same thing. • Mass is the amount of matter in an object. • Weight is a measure of the pulling force of gravity on an object.
2.1 Mass and weight are different • A 2.3 kg bag of flour has a mass of 2.3 kilograms no matter where it is in the universe. • The weight of the bag of flour is less on the moon. The 5 lb bag of flour on Earth weighs only .8 lbs on the moon!
2.1 Volume • Volume is the amount of space an object takes up. • The fundamental unit of volume in SI is the cubic meter (m3). • More convenient smaller units are cubic centimeters (cc or cm3), liters (L) and milliliters (mL).
2.1 Volume • Measuring the volume of liquids is easy. • Pour the liquid into a graduated cylinderand read the meniscus at eye level.
2.1 Displacement • You can find the volume of an irregular shape using a technique called displacement. • Put the irregularly shaped object in water and measuring the amount of water displaced.
2.1 Comparing mass and volume • Mass and volume are two different properties of matter. • Size does not always indicate an object’s mass! • How the matter is packed into space is more important.
Chapter Two: Science Skills • 2.1 Mass and Volume • 2.2 Density • 2.3 Graphing • 2.4 Solving Problems
Section 2.2 Learning Goals • Define density in terms of mass and volume. • Identify units used to express the density of materials. • Apply the density formula to solve problems.
Key Question: How is an object’s density related to its volume, mass, and tendency to sink or float? Investigation 2B Density
2.2 Density • Density describes how much mass is in a given volume of a material.
2.2 Density • Solids, liquids and gases are matter, so they all have density. • The density of water is about one gram per cubic centimeter.
2.2 Density • The units used for density depend on whether the substance is solid or liquid. • For liquids use units of grams per milliliter (g/mL) • For solids use density in units of g/cm3 or kg/m3.
2.2 Density of common materials • Density is a property of material independent of quantity or shape.
2.2 Density of common materials • Liquids tend to be less dense than solids of the same material. • Ex. solder (“sodder)
2.2 Density of common materials • Water is an exception to this rule. • The density of solid water (ice) is less than the density of liquid water.
2.2 Determining Density • To find the density of a material, you need to know the mass and volume of a solid sample of the material. • Mass is measured with a balance or scale. • Use the displacement method or calculate the volume.
2.2 Density Density changes for different substances because: • Atoms have different masses. • Atoms may be “packed” tightly or loosely.
Solving Problems Calculating Density • Looking for: • …the density of the candle • Given: • …mass = 1500 g; volume = 1700 mL • Relationship: • D = m/V • Solution: • 1,500 g ÷ 1,700 mL = 0.8823529 g/mL # Sig. fig = .88 g/mL
Chapter Two: Science Skills • 2.1 Mass and Volume • 2.2 Density • 2.3 Graphing • 2.4 Solving Problems
Section 2.3 Learning Goals • Use graphs to create a visual representation of data. • Analyze trends on a graph. • Explain the difference between a direct relationship and an inverse relationship.
Key Question: What is the thickness of aluminum foil? Investigation 2C Thickness of Aluminum Foil
2.3 Graphing • A graph is a visual way to organize data. • A scatterplot or XY graphis used to see if two variables are related.
2.3 Graphing • A bar graphcompares data grouped by a name or category.
2.3 Graphing • A pie graph shows the amount each part makes of up of the whole (100%).
2.3 Graphing • A “connect-the-dots” line graph is often used to show trends in data over time.
2.3 How to make an XY graph • Scatterplotsshow how a change in one variable influences another variable. • The independent variable is the variable you believe might influence another variable. • The dependent variable is the variable that you hope will change as a result of the experiment.
2.3 How to make an XY graph • Pressure is critical to safe diving. • How does an increase in depth affect the pressure? • What sort of graph would best show the relationship between pressure and depth?
2.3 How to make an XY graph • Choose x and y-axis • Depth is the independent variable = x axis • Pressure is the dependent variable = y axis • Make a scale • Most graphs use ones, twos, fives or tens • OR calculate the value per box • Plot your data • Create a title * Exception- when time is a variable
2.3 Identifying graph relationships • In a direct relationship, when one variable increases, so does the other. The speed and distance variables show a direct relationship.
2.3 Identifying graph relationships • When there is no relationship the graph looks like a collection of dots. No pattern appears.
2.3 Identifying graph relationships • In an inverse relationship, when one variable increases, the other decreases.
2.3 Reading a graph What is the speed of the car at 50 cm? • Find the known value on the x axis • Position = 50 cm • Draw a line vertically upward from 50 cm until it hits the curve. • Draw a line across horizontally to the y-axis from the same place on the curve. • Read the speed using the y axis scale. • Speed = 76 cm/s
Chapter Two: Science Skills • 2.1 Mass and Volume • 2.2 Density • 2.3 Graphing • 2.4 Solving Problems
Section 2.4 Learning Goals • Apply a four-step technique to solve problems. • Use the design cycle to solve problems.