Download
1 / 31
310 likes | 557 Views
Diversity Network Meeting. Office of Bilingual Education & Foreign Language Studies Pedro J. Ruiz, Ph.D. Coordinator. Organization Chart NYS OBE-FLS. Pedro J. Ruiz, Ph.D. Coordinator. Virginia Perez Bilingual Secretary. TBD Bilingual Supervisor. TBD Secretary.

E N D
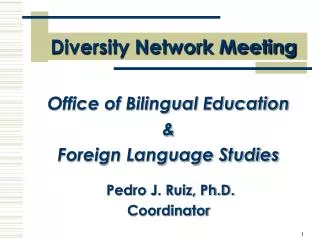
Diversity Network Meeting Office of Bilingual Education & Foreign Language Studies Pedro J. Ruiz, Ph.D. Coordinator
Organization Chart NYS OBE-FLS Pedro J. Ruiz, Ph.D. Coordinator Virginia Perez Bilingual Secretary TBD Bilingual Supervisor TBD Secretary Ileana Olazagasti Bilingual Associate Mary Enright Bilingual Associate TBD Foreign Language Associate TBD NYC Bilingual Supervisor Edith Cruz Bilingual Associate TBD NYC Secretary TBD NYC Clerk
Configuration of BETACs Beginning in July 2006, the Statewide BETAC configuration will consist of 14 BETACS: • New York City BETACs • Bronx • Manhattan and Staten Island • Queens and Brooklyn • Language Specific BETACs • Haitian Creole Language (HABETAC) • Asian Language (ALBETAC) • Spanish Language (SBETAC) • “Rest of State” (ROS) BETACs • Eastern/Western Suffolk BOCES • Erie I BOCES • Mid-Hudson BOCES • Monroe 2-Orleans BOCES • “Rest of State” (ROS) BETACs • Onondaga-Cortland-Madison BOCES • Questar BOCES • Southern Westchester BOCES • Nassau BOCES
The Good News • Bilingual Education Aid was increased from $11.2 to $11.5 million. This aid funds the following programs: • Bilingual Education/ESL Technical Assistance Centers (BETACs) • Two-Way Bilingual Education Grants • Intensive Teacher Institute • Bilingual/ESL Teacher Leadership Academy • Hispanic Youth Leadership Institute • Bilingual Performing Arts Program • Administrators Leadership Academy
The Good News • LEP Aid to school districts was increased by $20 million and restored as a separate item in the NYS budget: • A higher percentage of funding will be distributed to each district claiming LEP Aid, based on the number of LEP/ELLs reported on the 2006-07 CR Part 154 application.
Current Areas of Concern • Data Collection Inconsistencies • Graduation of LEP/ELLs & High School Dropout Rate • Parent Involvement • Number of Uncertified Teachers • Streamlining CR Part 154 & Title III process
Ongoing Initiatives • Hold Teacher Institutes throughout the State • Participate in Hispanic Youth Leadership Institute • Continue to fund and increase Two-Way Bilingual Education Programs • Develop and refine the NYSESLAT • Expand ongoing Professional Development through BETLA, Administrators Academies, and other regional initiatives • Redesign and update NYSBEN • Implement Quality Review initiative • Continue Random Monitoring of Districts/Schools
New Initiatives • Establish a “Committee of Researchers” and a “Panel of Experienced Practitioners” to advise the Commissioner and the Board of Regents • Re-establish the Teacher Exchange Program • Increase parent involvement of LEP/ELLs • Plan and hold a Research Conference on LEP/ELLs in 2007 • Develop and publish guidelines for LEP/ELLs, including: • Students with Interrupted Formal Education (SIFE) • Students from Africa • Refugee Students • English Speaking Caribbean Students • Bilingual Special Education Students • Implementing Reading First in Bilingual and ESL Programs • Update to CR Part 154 Guidelines/NCLB Title III
Looking at the Data High School Cohorts NYSESLAT Results
Cohort Enrollment Cohort Enrollment Regents Local Diploma Regents Local Diploma IEP Diploma IEP Diploma % Still Enrolled % Still Enrolled Transferred to GED Transferred to GED Dropped Out Dropped Out NYC 9,584 9,755 40.2% 25.8% 4.1% 3.6% 15.9% 44.7% 5.1% 3.2% 22.6% 34.8% ROS ROS 2,426 2,899 42.4% 56.7% 1.1% 1.3% 11.1% 30.4% 6.9% 8.7% 19.2% TOTAL 12,654 12,010 43.5% 29.6% 3.5% 3.1% 41.4% 14.9% 5.8% 4.0% 21.8% 32.3% 22.2% NYC TOTAL High School Cohort Outcome Statistics for LEP/ELLs LEP/ELLs who entered Grade 9 in 2000 Cohort - After Five Years LEP/ELLs who entered Grade 9 in 2001 Cohort - After Four Years
What do these charts tell us? • LEP/ELL students are most likely toneed an additional year of schooling • 41.4% were still enrolled after four years • 14.9% were still enrolled after five years • 21.8% dropout rate of ELLs after four years • 32.3% dropout rate of ELLs after five years • Fewer than half of LEP/ELL students graduated
Grade Span Total Number of ELLs Tested Percent Reaching Proficiency K-1 34,996 9.9% 2-4 52,460 13.9% 5-6 24,262 11.6% 7-8 24,594 12.5% 9-12 42,262 10.8% Total 178,574 11.3% 2005 NYSESLAT Data
2005 NYSESLAT Data • One area of concern involves the difference in numbers of LEP/ELLs identified and taking the NYSESLAT, i.e., 25,000 to 30,000 students: • Possible reasons: • Transience between districts • Students who enter and leave the country or State during the same year • Students who were exited on a “local option” basis, but who were identified as LEP/ELL on BEDS forms in prior October • In addition, around 5.5% (10,000) did not have valid scores because they were missing one or more sections of the test.
Actions to Close the Gap for Limited English Proficient/ English Language Learners • Improve the quality of bilingual and English as a Second Language (ESL) teachers through new incentives and expanded professional development opportunities. • Support the preparation of special education and bilingual special education teachers through the ITI-BE program by expanding outreach to minority populations. • Convene a Committee of Researchers and an Advisory Council of Practitioners in Bilingual Education and ESL to make recommendations to NYSED. • Increase outreach with the New York City Department of Education to provide better information to parents on ESL and bilingual programs that can improve their own levels of reading, writing, and speaking English.
Actions to Close the Gap for Limited English Proficient/ English Language Learners • Hold schools and districts accountable for meeting improvement targets in English language acquisition. • Increase monitoring to ensure that students are receiving all required time and services in English and native language instruction, and report results. • Districts that fail to implement the requirements will not be granted approval of their Part 154 Comprehensive Plan and will not be entitled to claim State or federal funds for the education of LEP/ELL students.
Quality Review of Services for LEP/ELLs The Quality Review process is a comprehensive self-assessment tool designed to help school leadership and instructional staff to review and evaluate the quality of all LEP/ELL-related processes, practices and strategies in place in the school system.
Students Concerns • “I was told by one of my teachers that no Hispanic student have ever passed her class.”Lack of a school support system to inspire them, motivate them, and give them the correct information they need to graduate. This included getting the credits and classes they need to graduate on time. • “It’s not about the content, It’s about not knowing English.”NYC schools are closing bilingual programs reducing the possibility for recently “arrived students” to be placed in bilingual programs, to help them pass content Regent exams, which can be taken in many languages. The schools are asking students to produce in English, content information that could be given in Spanish classes. • “The school system sets us up for failure from the beginning.”If we want to receive a HS Regents diploma, we need to pass the English Language Arts Regents exam. There is no incentive to stay in school, knowing that this will never happen. • “The school system discriminates against us”Students feel that they are not given a presence in the school environment. Too many fights between Hispanics and other students.
Students Concerns • “Good programs are not given to us.”Students feel that AP classes and other classes for gifted kids are not available to them. • “Our families’ needs are more important than school.”We need to help our parents pay the bills by looking for jobs or taking care of younger siblings, and the house. • “We did not choose to be here, we are here because of our parents.”If undocumented immigrants want to continue his/her education, they would have to pay double or more, than a US citizen for university credits. The majority come from low income households that cannot afford to pay, even if they would like to attend. They express their frustration with parents’ decision in putting them in this situation. • “My parents never went to school.”Lack of parent support and encouragement to continue their education. • “School counselors are not bilingual and always busy with other students”.Many students complained that they do not receive information about college, scholarships, internships and loans.
What Can Schools Do to Address the Educational Needs of Ells? Does Bilingual Education Really Work? Literally hundreds of scientific studies over the past half century have shown that bilingual education – when well designed and well implemented – is an effective approach for teaching second language learners. These findings have been consistent across numerous national borders and languages of instruction, all pointing to the conclusion that bilingual education "works." To cite just one example, a major longitudinal study released in 1991 by the U.S. Department of Education found that the more schools developed children's native-language skills, the higher they scored academically over the long term in English. Students also benefited from acquiring fluency and literacy in two languages.
Other Scientific Studies Ramirez et al. (1991). This federally funded study traced the progress of more than 2,000 Spanish-speaking ELLs in nine school districts in five states over a four-year period. It found that students in developmental bilingual programs – which featured a gradual transition to English – significantly outperformed their counterparts in quick-exit, transitional bilingual programs and in all-English immersion programs when all three groups were tested in English. Oller and Eilers (2000). The researchers compared 952 students in Dade County, Florida, enrolled in bilingual and English immersion programs. It reported that bilingual children scored higher in English literacy by 2nd grade – a gap that widened significantly by 5th grade. Thomas and Collier (2002). Another federally funded study, this research confirmed the patterns reported by Ramirez et al. ELLs in Houston did better academically in programs that stressed native-language development. They fared best in two-way – a.k.a. dual immersion – programs in which English-speaking children learned Spanish alongside ELLs learning English.
Using Two Languages in the Classroom Is No Magic Potion Bad teaching is bad teaching in any language. What matters is how the languages are used – simply to provide translations or to stimulate students' cognitive and academic growth. What are the program's goals – a "quick exit" to the mainstream or the development of fluent bilingualism and biliteracy? Some Essential Questions Are teachers well trained to meet the needs of English language learners (ELLs)? Does the school provide adequate resources, materials, and support services? Are parents involved in their children's education? Is the program supported by the local school board and district administrators?
Language(s) of Instruction Typical Program Names Native Language of Students Language(s) of Content Instruction Language Arts Instruction Linguistic Goal of Program English and the Native Language Two-way Bilingual Education, Bilingual Immersion, or Dual Language Immersion Ideally, 50% of English-speaking and 50% LEP students sharing same native language Both English and the native language English and the native language Bilingualism Late-exit or Developmental Bilingual Education All students speak the same native language Both; at first, mostly the native language is used. Instruction through English increases as students gain proficiency English and the native language Bilingualism Early-exit or Transitional Bilingual Education All students speak the same native language Both at the beginning, with quick progression to all or most instruction through English English; native language skills are developed only to assist transition to English English acquisition; rapid transfer into English-only classroom Types of Language Instruction Educational Programs
Language(s) of Instruction Typical Program Names Native Language of Students Language(s) of Content Instruction Language Arts Instruction Linguistic Goal of Program English Sheltered English, Specially Designed Academic Instruction in English (SDAIE) Structured Immersion, or Content-based ESL Students can share the same native language or be from different language backgrounds English adapted to the students’ proficiency level, and supplemented by gestures and visual aids English English acquisition Pull-out ESL Students can share the same native language or be from different language backgrounds; students may be grouped with all ages and grade levels English adapted to the students’ proficiency level, and supplemented by gestures and visual aids English; students leave their English-only classroom to spend part of their day receiving ESL instruction English acquisition Types of Language Instruction Educational Programs
Language(s) of Instruction Typical Program Names Native Language of Students Language(s) of Content Instruction Language Arts Instruction Linguistic Goal of Program Non-English (Foreign) language Foreign Language Program English Foreign/target language is the only content area taught Foreign/target language Foreign/second language acquisition Foreign Language Immersion (Full or Partial) English Foreign/target language Foreign/target language and English Bilingualism Types of Language Instruction Educational Programs
Language(s) of Instruction Typical Program Names Native Language of Students Language(s) of Content Instruction Language Arts Instruction Linguistic Goal of Program Native Language Heritage Language English, with non-English language background and/or proficiency; or non-English language speaker. All students share same non-English language. Target languages the primary content area taught Target language Bilingualism Types of Language Instruction Educational Programs
SOURCE: U.S. Department of Education's survey of the states' limited English proficient students and available educational programs and services, 1991-92 through 2001-2002 summary reports. Supplemented by state publications (1998-99 data), and enrollment totals from the National Center for Education Statistics (NCES). 1 The 2000-2001 SEA survey categorized ELLs as LEPs (limited English proficient students). 2002-2003 and 2003-2004 data was reported by states. Relative Growth in ELL and Total Enrollment in U.S. Schools, 1989-90 to 2003-2004
PreK-12 ELL Public School Enrollment, by State, 2003-2004, and Change in Enrollment from 1993-94 Based on state-reported data, it is estimated that 5,013,539 ELL students were enrolled in public schools (Pre-K through Grade 12) for the 2003-2004 school year. This number represents approximately 10.1% of total public school student enrollment, and a 65.0% increase over the reported 1993–94 public school ELL enrollment. Among the states, California enrolled the largest number of public school ELL students, with 1,598,535, followed by Texas (660,707), Florida (282,066), New York (191,992), Illinois (161,700), and Arizona (144,145).
Summary • Strengthen Programs and Parental Involvement • Provide Resources to Districts and Schools • Support Professional Development • Improve Teacher Recruitment/Certification • Increase Monitoring for Accountability • Use Data to Inform Decision Making • Ensure Compliance at Federal, State and Local Levels