Download
1 / 42
420 likes | 539 Views
Learn how to manipulate arrays using subscripts and plot colorful shapes. Understand square bracket notation and built-in functions for efficient coding. Master array subscripts for specific data access and modification.

E N D
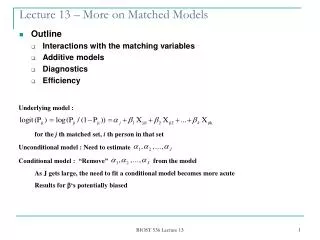
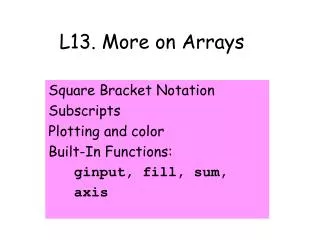
13. More on Arrays Square Bracket Notation Subscripts Plotting and color Built-In Functions: ginput, fill, sum, axis
0.00 0.25 0.50 0.75 1.00 The Square Bracket These are equivalent: x = linspace(0,1,5) x = [ 0 .25 .50 .75 1.00] x: Handy for setting up “short” vectors.
Three “Short Vector” Examples Line Segments Little Polygons Color
Plotting a Line Segment a = 1; b = 2; c = 3; d = 4; plot([a c],[b d]) This draws a line segment that connects (1,2) and (3,4): A natural mistake: plot([a b],[c d])
Drawing Little Polygons x = [a a+L a+L a a]; y = [b b b+W b+W b]; plot(x,y) This draws an L-by-W rectangle with lower left corner at (a,b): Connect (a,b) to (a+L,b) to (a+L,b+W) to (a,b+W) to (a,b)
Coloring Little Polygons x = [a a+L a+L a a]; y = [b b b+W b+W b]; fill(x,y,c) This draws an L-by-W rectangle with lower left corner at (a,b) and colors with the color named by c: Connect (a,b) to (a+L,b) to (a+L,b+W) to (a,b+W) to (a,b) and then fill it in.
Built-In Function Fill fill( , , ) Vectors that specify the vertices of a polygon. Specify the fill-in color.
x = [0.11 -0.99 -0.78 0.95] y = [0.99 0.08 -0.62 -0.30] fill(x,y,’y’)
DrawRect function DrawRect(a,b,L,W,c) x = [a a+L a+L a a]; y = [b b b+W b+W b]; fill(x,y,c)
Color is a 3-vector Any color is a mix of red, green, and blue. Represent a color with a length-3 vector and an “rgb convention”. c = [ 0.250.630.00 ] green value between 0 and 1 blue value between 0 and 1 red value between 0 and 1
Some Favorites White [0 0 0] Blue [0 0 1] Green [0 1 0] Cyan [0 1 1] Red [1 0 0] Magenta [1 0 1] Yellow [1 1 0] Black [1 1 1]
A Problem Display all colors [r g b] where r ranges over the values 0.00 0.25 0.50 0.75 1.00 g ranges over the values 0.00 0.25 0.50 0.75 1.00 b ranges over the values 0.00 0.25 0.50 0.75 1.00
Preliminary Notes There will be 5 x 5 x 5 = 125 colors to display. To display a color, we will draw a unit square with that color.
Script Derivation for r = 0:.25:1 Display all colors with red value r. end Refine This!
Script Derivation for r = 0:.25:1 for g = 0:.25:1 Display all colors with red value r and green value g. end end Refine This!
Script Derivation for r = 0:.25:1 for g = 0:.25:1 for b = 0:.25:1 Display the color with red value r, green value g, and blue value b. end end end Refine This!
Script Derivation for r = 0:.25:1 for g = 0:.25:1 for b = 0:.25:1 c = [r g b]; fill(x,y,c) end end end Done!
0.00 0.25 0.50 0.75 1.00 Subscripts It is possible to access and change specific entries in an array. x = [ 0 .25 .50 .75 1.00] The value ofx(1) is 0.00 . The value ofx(2) is 0.25 . The value ofx(3) is 0.50 . The value ofx(4) is 0.75 . The value ofx(5) is 1.00 . x:
0.00 0.25 0.50 0.75 1.00 Subscripts It is possible to access and change specific entries in an array. x = [ 0 .25 .50 .75 1.00] x: 0.00 0.25 0.50 0.75 1.00 a = x(1) a = x(2) a = x(3) a = x(4) a = x(5)
0.00 0.25 0.50 0.75 1.00 Subscripts It is possible to access and change specific entries in an array. x = [ 0 .25 .50 .75 1.00] x: 0.00 0.25 0.50 0.75 1.00 for k = 1:5 a = x(k) end
0.00 0.25 0.50 0.75 1.00 Subscripts It is possible to access and change specific entries in an array. x = [ 0 .25 .50 .75 1.00] x: a = x(1)+x(2) a = x(2)+x(3) a = x(3)+x(4) a = x(4)+x(5) 0.25 0.75 1.25 1.75
0.00 0.25 0.50 0.75 1.00 Subscripts It is possible to access and change specific entries in an array. x = [ 0 .25 .50 .75 1.00] x: 0.25 0.75 1.25 1.75 for k=1:4 a = x(k)+x(k+1) end
Subscripts This x = linspace(a,b,n) is equivalent to this h = (b-a)/(n-1); for k=1:n x(k) = a + (k-1)*h; end
0.00 0.25 0.50 0.75 1.00 Subscripts h = (1-0)/(5-1); x(1) = 0 + 0*h; x(2) = 0 + 1*h; x(3) = 0 + 2*h; x(4) = 0 + 3*h; x(5) = 0 + 4*h; x:
Subscripts h = (b-a)/(n-1); for k=1:n x(k) = a + (k-1)*h ; end x(k) a + (k-1)*h Recipe for a value Where to put it.* * Only now we compute where to put it.
A Problem Click in the three vertices of a triangle. Display the triangle. Compute the centroid (xc,yc). Highlight the centroid and the vertices. Connect each vertex to the centroid.
Clicking in the Vertices The command [x,y] = ginput(3) will assign the xy coordinates of the clicks to the arrays x and y. Clicks: (1,2), (3,4), (5,6) x: y: 2 4 6 1 3 5
Display the Triangle fill(x,y,’y’)
Compute the Centroid xc = (x(1) + x(2) + x(3))/3; yc = (x(1) + y(2) + y(3))/3; The x coordinate of the centroid is the average of the x-coordinates of the vertices. Ditto for y-coordinate.
Highlight the Vertices and Centroid plot(x,y,’ok’,xc,yc,’*k’)
Connect Each Vertex to the Centroid plot([xc x(1)],[yc y(1)]) plot([xc x(2)],[yc y(2)]) plot([xc x(3)],[yc y(3)])
Overall [x,y] = ginput(3) fill(x,y,’y’) xc = (x(1)+x(2)+x(3))/3; yc = (y(1)+y(2)+y(3))/3; plot(x,y,’ok’,xc,yc,’*k’) plot([xc x(1)],[yc y(1)]) plot([xc x(2)],[yc y(2)]) plot([xc x(3)],[yc y(3)])
More General n = 3; [x,y] = ginput(n) fill(x,y,’y’) xc = sum(x)/n; yc = sum(y)/n; plot(x,y,’ok’,xc,yc,’*k’) for k=1:n plot([xc x(k)],[yc y(k)]) end
Question Time What is the output? x = [10 20 30]; y = [3 1 2] k = y(3)-1; z = x(k+1) A. 11 B. 20 C. 21 D. 30 E. 31
A Problem Plot the function y = sin(x) across [0,2pi] but add random noise if In particular, use sin(x)+.1*randn(1) if x is in this range.
Solution x = linspace(0,2*pi,n); y = sin(x); for k=1:n if 2*pi/3 <= x(k) && x(k) <= 4*pi/3 y(k) = y(k) + .1*randn(1); end end plot(x,y) axis([0 2*pi -1.2 1.2 ]) x range:[0 2pi] y range: [-1.2 1.2]
Problem On a black background, click in the location of 10 stars. (A “constellation”.) Repeat many times: for k=1:10 Redraw the k-th star using black or yellow with equal probability end This box redraws the constellation.
To Simulate Twinkling… [x,y] = ginput(10); for k = 1:100 for j=1:10 if rand < .5 DrawStar(x(j),y(j),r,'k') else DrawStar(x(j),y(j),r,'y') end pause(.01) end end
Subscripting Review for j=1:3 DrawStar(a(j),b(j),.1,’y’) end j=1 DrawStar(3,2,.1,’y’) a: 3 1 7 b: 2 8 4
Subscripting Review for j=1:3 DrawStar(a(j),b(j),.1,’y’) end j=2 DrawStar(1,8,.1,’y’) a: 3 1 7 b: 2 8 4
Subscripting Review for j=1:3 DrawStar(a(j),b(j),.1,’y’) end j=3 DrawStar(7,4,.1,’y’) a: 3 1 7 b: 2 8 4