Download
1 / 36
360 likes | 500 Views
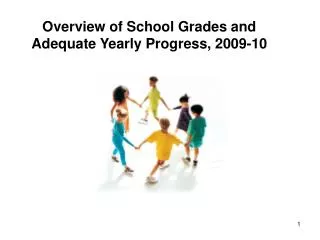
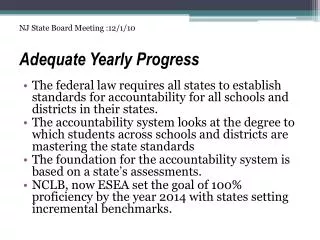
Overview of MCAS Results and Adequate Yearly Progress Determinations 2006. Brockton School Committee November 21, 2006. Overview of 2006 MCAS results. Grades and subjects tested State and district gains since 1998 Other longer-term gains District and state performance levels

E N D
Overview of MCAS Resultsand Adequate Yearly Progress Determinations2006 Brockton School Committee November 21, 2006
Overview of 2006 MCAS results • Grades and subjects tested • State and district gains since 1998 • Other longer-term gains • District and state performance levels • Passing and proficiency rate comparisons • Recent improvements in subgroup performance 2
The passing rate on the state's assessment test for first time test takers has risen from less than 50 percent in 1998 to 84 percent in 2006. And the percentage of 10th graders scoring at least Proficient on the English and Math exams has risen from 38 percent in 2001 to 59 percent in 2006. October 30, 2006 DOE news release announcing Commissioner’s retirement 4
The passing rate on the state's assessment test for first time test takers has risen from less than 50 percent in 1998 to 84 percent in 2006. And the percentage of 10th graders scoring at least Proficient on the English and Math exams has risen from 38 percent in 2001 to 59 percent in 2006. October 30, 2006 DOE news release announcing Commissioner’s retirement 5
The passing rate on the state's assessment test for first time test takers has risen from less than 50 percent in 1998 to 84 percent in 2006. And the percentage of 10th graders scoring at least Proficient on the English and Math exams has risen from 38 percent in 2001 to 59 percent in 2006. October 30, 2006 DOE news release announcing Commissioner’s retirement 6
2006 MCAS RATES FOR PASSING AND ADVANCED/PROFICIENT BY GRADE LEVEL (DARKER BLUE/GOLD BARS = ADVANCED/PROFICIENT) 12
State & Brockton Cycle IV CPI for English Language Arts State & Brockton Cycle IV CPI Gains in English Language Arts 13
State & Brockton Cycle IV CPI for Mathematics State & Brockton Cycle IV CPI Gains in Mathematics 14
Adequate Yearly Progress • Composite Proficiency Index (CPI) • Grade level CPI - 2006 • State and large urban CPI - 2006 • District and state CPI over time • AYP calculation and status • Consequences and context statewide • Beyond 2006 15
CPI=Composite Performance Index Index Points 71.3 17
2006 STATE/DISTRICT CPI BY GRADE LEVEL BARS = BROCKTON, LINE = STATE CPI 18
SIX-YEAR DISTRICT AND STATE CPI COMPARISON FOR ENGLISH LANGUAGE ARTS STATE 5-YEAR GAIN = 3.8 8.7 11.6 BROCKTON 5-YEAR GAIN = 6.7 2001 2002 2003 2004 2005 2006 21
SIX-YEAR DISTRICT AND STATE CPI COMPARISON FOR MATHEMATICS STATE 5-YEAR GAIN = 8.2 BROCKTON 5-YEAR GAIN = 9.0 12.6 13.4 2001 2002 2003 2004 2005 2006 22
How is AYP calculated? (100 – Cycle III CPI) / 5 23
Sample 2006 district AYP history table New method 2006- Old method 2001-2005 New method Old method 24
When schools do not make AYP fortwo consecutive years Statewide 382 schools identified for improve-ment 206 in the aggregate 176 for subgroups Schools that do not make AYP for two consecutive years in either subject for any group are identified for improvement. • Schools identified for improvement are required to develop a plan for improving student performance. • Title I schools identified for improvement are also required to offer • school choice in first year of improvement status; • supplemental services in second year, if fail to make AYP after first year. 25
Schools in corrective action status Statewide 188 schools in corrective action 49 in the aggregate 139 for subgroups Schools identified for improvement that do not make AYP for two additional years are identified for corrective action. Districts with schools in corrective action are required to - • Institute new curriculum relevant to school’s low performance and provide professional development to support its implementation; • Extend length of school year or school day; • Replace school staff deemed relevant to school not making adequate progress; • Significantly decrease management authority at the school; • Restructure internal organization of the school; or • Appoint one or more outside experts to advise school in its improvement efforts. 27
Schools in restructuring status Schools in corrective action that do not make AYP in 2006 are identified for restructuring. Districts with schools in restructuring status are required - • Reconstitute the school by replacing school staff relevant to the school’s inability to make adequate progress; • Enter into contract with an entity with a demonstrated record of effectiveness to operate the school as a public school; • Turn operation of the school over to State educational agency, if the State agrees; • Re-open the school as a public charter school; or • Implement “any other major restructuring of the school's governance arrangement that makes fundamental reforms, such as significant changes in the school's staffing and governance, to improve student academic achievement in the school and that has substantial promise of enabling the school to make adequate yearly progress.…” Statewide 59 schools in 20 districts are in restructuring status 29
Districts identified for improvement or corrective action Districts that do not make AYP for two consecutive years in either subject for any group, at all grade-spans, are identified for improvement. Districts identified for improvement year 2 that do not make AYP in 2006 at all grade-spans are identified for corrective action. For districts in corrective action, the State has options to – • Defer programmatic funds or reduce administrative funds; • Institute new curriculum relevant to districts’ low performance and provide professional development to support its implementation; • Replace district personnel relevant to inability of district to make adequate progress; • Remove individual schools from the jurisdiction of the district and arrange for their public governance and supervision; • Appoint a receiver or trustee to administer the affairs of the district in place of the superintendent and school board; or • Abolish or restructure the district. Statewide 26 districts are in corrective action (9 aggregate and 17 for subgroups), 104 districts identified for improvement 31
Of the 234 public school districts, 130 or 56% districts have been negatively identified – By subject area ELA(23), Math (55) ELA and Math (52) Aggregate - Corrective Action (9) Subgroups – Corrective Action (17) Improvement (104) Of the 1772 public schools, 629 or 35% have been negatively identified – Aggregate (314) Restructuring (59) Corrective Action (49) Improvement (206) Subgroups (315) Corrective Action (139) Improvement (176) Cycle IV status of districts and schools statewide 33
` Projected path in ELA Projected path in Math 35
END 36 Office of Accountability, Planning and Technology