Download
1 / 19
190 likes | 341 Views
Causal Inference and Adequate Yearly Progress. Derek Briggs. University of Colorado at Boulder National Center for Research on Evaluation, Standards, and Student Testing (CRESST) CRESST Conference Los Angeles, CA September 9, 2004. Overview. Description and “Adequacy”

E N D
Causal Inference and Adequate Yearly Progress Derek Briggs University of Colorado at Boulder National Center for Research on Evaluation,Standards, and Student Testing (CRESST) CRESST ConferenceLos Angeles, CASeptember 9, 2004
Overview • Description and “Adequacy” • Causal Inference in the Context of NCLB-AYP • Causal Inference in the Context of Value-Added Models (VAMs) • Are we addressing causally meaningful questions? • Directions for Future Research
AYP as a Descriptive Measure • Two 4th grade teachers: Sylvia and Susan • Sylvia’s students met AYP target in 2004 for 4th grade reading • Susan’s students did NOT meet AYP target in 2004 for 4th grade reading • But this leads us naturally to ask WHY: • Why did Sylvia’s students meet AYP targets • Why did Susan’s students fail to meet AYP target?
The Slippery Slope from Description to Causation “Casual comparisons inevitably initiate careless causal conclusions” --Paul Holland, 2000 EXAMPLES of Causal Attributions: • Sylvia’s students met AYP target because state standards were properly emphasized. • Susan’s students did not meet AYP target because they lacked necessary resources. • Students taught by Sylvia are learning to read better than students taught by Susan.
Defining Causal Inferences from NCLB • What is the effect of Sylvia’s efforts to improve student reading ability as measured by 4th grade test scores? • Average 2004 scale score for Sylvia’s class • COUNTERFACTUAL SUBSTITUTION • Average causal effect attributed to Sylvia
What is the Appropriate Counterfactual Substitution? • Is • The average scale score on 4th grade reading test for Sylvia’s class in 2003? • or • The average scale score on 4th grade reading test for Susan’s class in 2004? This choice determines how we interpret the meaning of the causal effect. The “control” defines the “treatment”.
The Implied NCLB Counterfactual • Average scale score on 4th grade reading test for Sylvia’s 2003 class • Teachers serve as their own historical controls • AYP can be viewed as an external judgment as to the expected size of the effect • Effects can’t be interpreted relative to other teachers • Threats to validity are numerous
An Added Wrinkle: Standard Setting • Policy not based on • Instead, we focus on • where S(.) represents the transformation from scale score to % meeting a given standard • An empirical question: Do bNCLB and S(bNCLB) tell equivalent stories?
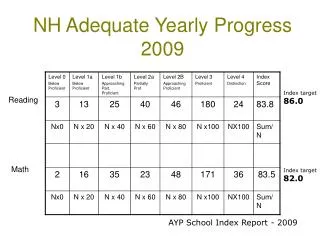
If you Believe the Counterfactual Substitution is Reasonable… • 60% of Sylvia’s students performed at the “proficient” level or higher on 4th grade reading test in 2003 • AYP target is 5% increase • 70% of Sylvia’s students performed at the “proficient” level or higher on 4th grade reading test in 2004 • The 10% improvement between 2003 and 2004 is attributed to Sylvia’s teaching. Sylvia’s effect > 5%, so it is considered adequate.
The Value-Added Approach • From repeated cross-sections to longitudinal data • Complex statistical models: fixed effects model, cross-classified model, multivariate mixed effects (layered) model • Controlling for prior student performance • Teachers only held accountable for what students learn (or fail to learn) • Direct estimates of teacher “effects”(?)
Some Key Issues with VAMs • Inclusion of covariates • Impact of missing data • Persistence & attribution of teacher effects • Impact of different methods of test construction, scaling and equating • Plausibility of modeling assumptions • Do VAM estimates of teacher effects have causally meaningful interpretations?
Teacher Effects in VAMs • What is the effect of Sylvia’s efforts to improve student reading ability as measured by 4th grade test scores? • Avg score for Sylvia’s 4th graders in 2004 • Avg score for Sylvia’s 4th graders when they were 3rd graders in 2003 • Avg score for ALL 4th graders in 2004 • Avg score for ALL 4th graders when they were 3rd graders in 2003 • Sylvia’s average causal effect
VAM Teacher Effects Graphically Outcome Source: Raudenbush (2004), p. 125 Time t t + 1 t + 2
Are VAM effects causally meaningful? • Teacher effects in VAMs are normative -Effects are relative to system average -Effective teacher in one school may be classified as ineffective in another school • A better term might be teacher deviations • The “treatment” is poorly defined • The control is ambiguous • Policy implications are murky
A Technical Digression: Are teacher effects random or fixed? • “Neither a fixed-effects model nor a random effects model is unambiguously better. The statistical implications of the choice may influence the decision, but it is also partly substantive: The best decisions may depend on the particular inferences that are considered most important. ” • ---(McCaffrey et al, 2003, p. 67) • “Fixed effects models become unwieldy when multiple time points and cohorts are available. Given that fixed effect estimates have good properties only in special circumstances, I would recommend random effects as a general approach.” • ---(Raudenbush, 2004, p. 127)
Random Effects and the Observed Data • The preceding quotes imply to me that the random effects assumption is just a statistical modeling decision. • But the decision is actually an empirical commitment about the nature of the observed data. • Are teacher effects really like independent random draws from a population distribution? What population? • What must we assume about how our observed data was generated? <End of technical digression>
Directions for Future Research • Demonstrate that cross-sectional and longitudinal data paint different pictures about student learning • Recast VAM-AYP effects to address causally meaningful questions -What is the effect of imposing a value-added accountability system on student learning? -What is the effect of innovative professional development on teacher effectiveness? • Validate VAM measures of teacher effects by developing criterion measures of teacher quality
Sources • Ballou, D., Sanders, W., & Wright, P. (2004). Controlling for student background in value-added assessment for teachers. Journal of Educational and Behavioral Statistics, 29(1), 37-66. • Kupermintz, H. (2003). Teacher effects and teacher effectiveness: a validity investigation of the Tennessee Value Added Assessment System. Educational Evaluation and Policy Analysis, 25(3), 287-298. • McCaffrey, D., Lockwood, J. R., Koretz, D., Louis, T., & Hamilton, L. (2004). Models for value-added modeling of teacher effects. Journal of Educational and Behavioral Statistics, 29(1), 67-102. • McCaffrey, D., Lockwood, J. R., Koretz, & Hamilton, L. (2003). Evaluating value-added models for teacher accountability. RAND Corporation: Santa Monica, CA. • Raudenbush, S. (2004). What are value-added models estimating and what does this imply for statistical practice? Journal of Educational and Behavioral Statistics, 29(1), 121-130. • Reckase, M. (2004). The real world is more complicated than we would like. Journal of Educational and Behavioral Statistics, 29(1), 117-120. • Rubin, D., Stuart, E., & Zanutto, E. (2004). A potential outcomes view of value-added assessment in education. Journal of Educational and Behavioral Statistics, 29(1), 103-116. • Seltzer, M., Choi, K., & Thum, Y. M. (2003). Examining relationships between where students start and how rapidly they progress: Using new developments in growth modeling to gain insights into the distribution of achievement within schools. Educational Evaluation and Policy Analysis, 25(3), 263-286. • Tekwe, C., Carter, R., Ma, C.-X., Algina, J., Lucas, M., Roth, J., Abet, M., Fisher, T., & Resnick, M. (2004). An empirical comparison of statistical models for value-added assessment of school performance. Journal of Educational and Behavioral Statistics, 29(1), 11-36. • Thum, Y. M. (2004). Measuring progress towards a goal: estimating teacher productivity using a multivariate multilevel model for value-added analysis. Sociological Methods of Research.