Download

1 / 33

E N D
4. Climate Sensitivity
5. Likely range of mean global temperature increase by the end of the 21st Century
16. created by perturbing 14
uncertain atmospheric and oceanic parameters, and executed under constant volcanic and
solar forcing scenarios for 200 years by internet volunteers. Models with little oceanic
temperature drift in the second 100 years are selected and used for transient forcing experiments.
created by perturbing 14
uncertain atmospheric and oceanic parameters, and executed under constant volcanic and
solar forcing scenarios for 200 years by internet volunteers. Models with little oceanic
temperature drift in the second 100 years are selected and used for transient forcing experiments.
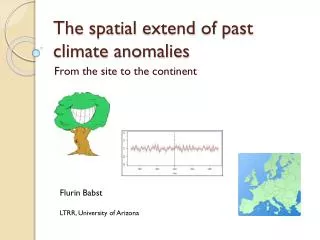
23. Figure 1: Locations of
the regional temperature
reconstructions and their
counterparts in the
FAMOUS model grid.
Red /blue boxes identify
warm/cold seasons. The
respective season and
first year of each proxy
record is indicated
within each box.Figure 1: Locations of
the regional temperature
reconstructions and their
counterparts in the
FAMOUS model grid.
Red /blue boxes identify
warm/cold seasons. The
respective season and
first year of each proxy
record is indicated
within each box.
30. Figure 4: Simulated averaged European annual-mean temperature change from the period
1970-1999 to 2070-2099 for the 627 of the simulations used in Figures 2-3 that also have
complete data in the 2070-2099 period. Ranking based on full proxy period (top) and
instrumental-only period (bottom). Horizontal axis holds the temperature change, while the
vertical axis holds the normalized T-statistic (note increasing negative values upwards). All
T-values larger than zero have been set to zero. Dashed vertical lines denote the range of the
dark-red coloured best-ranked (~3%) simulations. Dashed horizontal line denote the 1%
level for rejecting the null hypothesis that a forced simulation is equivalent with an unforced
one.Figure 4: Simulated averaged European annual-mean temperature change from the period
1970-1999 to 2070-2099 for the 627 of the simulations used in Figures 2-3 that also have
complete data in the 2070-2099 period. Ranking based on full proxy period (top) and
instrumental-only period (bottom). Horizontal axis holds the temperature change, while the
vertical axis holds the normalized T-statistic (note increasing negative values upwards). All
T-values larger than zero have been set to zero. Dashed vertical lines denote the range of the
dark-red coloured best-ranked (~3%) simulations. Dashed horizontal line denote the 1%
level for rejecting the null hypothesis that a forced simulation is equivalent with an unforced
one.