Download
1 / 37
370 likes | 502 Views
NONPARAMETRIC STATISTICS In general, a statistical technique is categorized as NPS if it has at least one of the following characteristics: The method is used on nominal data The method is used in ordinal data

E N D
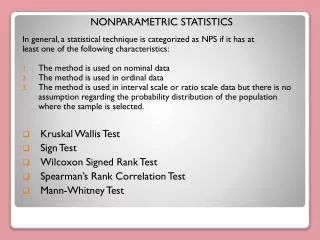
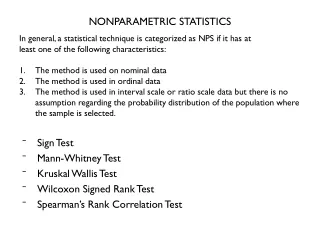
NONPARAMETRIC STATISTICS In general, a statistical technique is categorized as NPS if it has at least one of the following characteristics: • The method is used on nominal data • The method is used in ordinal data • The method is used in interval scale or ratio scale data but there is no assumption regarding the probability distribution of the population where the sample is selected. • Sign Test • Kruskal Wallis Test • Wilcoxon Signed Rank Test • Spearman’s Rank Correlation Test • Mann-Whitney Test
Wilcoxon Signed Rank Test When using this technique, those assumptions should be follow: 1. 2. 3.
Wilcoxon Signed Rank Test • Can be applied to two types of sample: one sample or paired sample • For one sample, this method tests whether the sample could have been drawn from a population having a hypothesized value as its median • For paired sample, to test whether the two populations from which these samples are drawn identical. • Important terms :- • - difference of paired samples • - modular of difference of paired samples • R- ranks • R( ) – signed-rank
The Wilcoxon Signed Rank test for one sample i. Null and alternative hypothesis: ii. Test procedure: • For each of the observed values, find the difference between each value and the median; where median value that has been specified • Ignoring the observation where , rank the values so the smallest will have a rank of 1. Where two or more differences have the same value find their mean rank, and use this. • For observation where , list the rank as column and list the rank as column
Then, sum the ranks of the positive differences, and sum the ranks of the negative differences . iii. The test statistic, W is the depends on the alternative hypothesis: For a two tailed test the test statistic For a one tailed test where the the test statistic, For a one tailed test where the the test statistic iv. Critical region: Compare the test statistic, W with the critical value in the tables; the null hypothesis is rejected if v. Make a decision
Example 5.1: An environmental activist believes her community’s drinking water contains at least the 40.0 parts per million (ppm) limit recommended by health officials for a certain metal. In response to her claim, the health department samples and analyzes drinking water from a sample of 11 households in the community. The results are as in the table below. At the 0.05 level of significance, by using Wilcoxon method can we conclude that the community’s drinking water might at least 40.0 ppm recommended limit?
1. Or (One tail test) 2. Based on the alternative hypothesis, the test statistic 3. From table of Wilcoxon signed rank for one tail test, 4. We will reject 5. Since , thus we failed to reject and conclude that the city’s water supply might have at least 40.0 ppm of the metal
Exercise 5.1: Student satisfaction surveys ask students to rate a particular course, on a scale of 1 (poor) to 10 (excellent). In previous years the replies have been symmetrically distributed about a median of 4. This year there has been a much greater on-line element to the course, and staff want to know how the rating of this version of the course compares with the previous one. 14 students, randomly selected, were asked to rate the new version of the course and their ratings were as follows: 1 3 6 4 8 2 3 6 5 2 3 4 1 2 Is there any evidence at the 5% level that students rate this version any differently?
The Wilcoxon Signed Rank test for paired sample i. Null and alternative hypothesis: ii. Test procedure: • For each of the observed values, calculate • Ignoring observation where , rank the values so the smallest will have a rank of 1. Where two or more differences have the same value find their mean rank, and use this. • For observation where , list the rank as column and list the rank as column
Then, sum the ranks of the positive differences, and sum the ranks of the negative differences iii. The test statistic, W is the depends on the alternative hypothesis: - For a two tailed test the test statistic - For a one tailed test where the the test statistic, - For a one tailed test where the the test statistic iv. Critical region: Compare the test statistic, W with the critical value in the tables; the null hypothesis is rejected if • Remember! If there are zero in differences, the value for n must subtracts the number of rows which contain zero in differences. v. Make a decision
Example 5.2: Two computer software packages are being considered for use in the inventory control department of a small manufacturing firm. The firm has selected 12 different computing task that are typical of the kinds of jobs. The results are shown in the table below. At the 0.10 level, can we conclude that those two computer software packages are identical?
1. (two tail test) Or 2. Based on the alternative hypothesis, the test is 3. 4. From table of Wilcoxon signed rank for two tail test, We will reject 5. Since , thus we reject and conclude that the software packages are not equally rapid in handling computing tasks like those in the sample, or the population median for is not equal to zero and that package x is faster than package y in handling computing task like ones sample.
Exercise 5.2: The following data gives the number of industrial accidents in ten manufacturing plants for one month periods before and after an intensive promotion on safety: Do the data support the claim that the plant before and after an intensive promotion are identical? Test at .
Exercise 5.3 An experiment was conducted to compare the densities of cakes prepared from two different cake mixes, A and B. Six cake pans received batter A and six received batter B. Expecting a variation in oven temperature, the experimenter placed an A and B cake side by side at six different locations in oven. Test the hypothesis of no difference in the median of population distributions of cake densities for two different cake batters. Test at .
Kruskal Wallis Test • It compares more than two independent samples • It is the non-parametric counterpart to the one way analysis of variance • However, unlike one way ANOVA, it does not assume that sample have been drawn from normally distributed populations with equal variances 1. The null hypothesis and alternative hypothesis:
2. Test statistic H • Rank the combined data values if they were from a single group. The smallest data value gets a rank of , the next smallest, 2 and so on. In the event of tie, each of the tied values gets their average rank • Add the rank fro data values from each of the k group, obtaining • The calculate value of the test statistics is:
3.Critical value of H: • The distribution of H is closely approximated by Chi-square distribution whenever each sample size at least 5, for = the level of significance for the test, the critical H is the chi-square value for and the upper tail area is . 4. Rejection region: We will reject 5. Conclusion
Example 5.6: Each of three aerospace companies has randomly selected a group of technical staff workers to participate in a training conference sponsored by a supplier firm. The three companies have sent 6, 5 and 7 employees respectively at the beginning of the session. A preliminary test is given, and the scores are shown in the table below. At the 0.05 level, can we conclude that the median scores for the three population of technical staff workers could be the same?
Solution: 1.
2. From and we reject 3. Calculated H : 4. Rejection region : 5.
Exercise 5.7: Four groups of students were randomly assigned to be taught with four different techniques, and their achievement test scores were recorded. At the 0.05 level, are the distributions of test scores the same, or do they differ in location?
Sign Test • The sign test is used to test the null hypothesis and whether or not two groups are equally sized. • In other word, to test of the population proportion for testing in a small sample (usually ) • It based on the direction of the + and – sign of the observation and not their numerical magnitude. • It also called the binomial sign test with the null proportion is 0.5 (Uses the binomial distribution as the decision rule). A binomial experiment consist of nidentical trial with probability of success, pin each trial. The probability of x success in n trials is given by
There are two types of sign test : 1. One sample sign test 2. Paired sample sign test
One Sample Sign Test Procedure: • Put a + sign for a value greater than the mean value Put a - sign for a value less than the mean value Put a 0 as the value equal to the mean value • Calculate: • The number of + sign, denoted by x • The number of sample, denoted by n (discard/ignore the data with value 0) 3. Run the test i. State the null and alternative hypothesis • Determine level of significance, • Reject • Determining the p – value for the test for n, x and p = 0.5, from binomial probability table base on the type of test being conducted
Example 5.4: The following data constitute a random sample of 15 measurement of the octane rating of a certain kind gasoline: 99.0 102.3 99.8 100.5 99.7 96.2 99.1 102.5 103.3 97.4 100.4 98.9 98.3 98.0 101.6 Test the null hypothesis against the alternative hypothesis at the 0.01 level of significance. Solution: 99.0 102.3 99.8 100.5 99.7 96.2 99.1 102.5 103.3 97.4 100.4 + + + + + - + + + = + 98.9 98.3 98.0 101.6 + + 0 + Number of + sign, x = 12 Number of sample, n = 14 (15 -1) p = 0.5
1. 2. 3. From binomial probability table for x = 12, n = 14 and p = 0.5 4. Since and conclude that the median octane rating of the given kind of gasoline exceeds 98.0
Paired Sample Sign Test Procedure: • Calculate the difference, and record the sign of • i. Calculate the number of + sign and denoted as x ii. The number of sample, denoted by n (discard/ignore data with value 0) * probability is 0.5 (p = 0.5) • Run the test i. State the null hypothesis and alternative hypothesis ii. Determine the level of significance iii. Reject iv. Determining the p value for the test for n, x and p = 0.5 from binomial probability table base on type of test being conducted. v. Make decision
Example 5.5: 10 engineering students went on a diet program in an attempt to loose weight with the following results: Is the diet program an effective means of losing weight? Do the test at significance level
Solution: Let the sign + indicates weight before – weight after > 0 and – indicates weight before – weight after < 0 Thus
1. The + sign indicates the diet program is effective in reducing weight 2. . So we reject 3. Number of + sign, Number of sample, 4. Since . So we can reject and we can conclude that there is sufficient evidence that the diet program is an effective programme to reduce weight.
Exercise 5.6: 8 panels of wood are painted with one side of each panel with paint containing the new additive and the other side with paint containing the regular additive. The drying time, in hours, were recorded as follows: Use the sign test at the 0.05 level to test the hypothesis that the new additive have the same drying time as the regular additive. Ans: Do not reject