Download
1 / 62
630 likes | 977 Views
Chapter 14 Nonparametric Statistics. Learn …. About Nonparametric Statistical Methods. Nonparametric Statistical Methods. Nonparametric methods are used: When the data are ranks for the subjects, rather than quantitative measurements. When it’s inappropriate to assume normality. .

E N D
Chapter 14Nonparametric Statistics • Learn …. About Nonparametric Statistical Methods
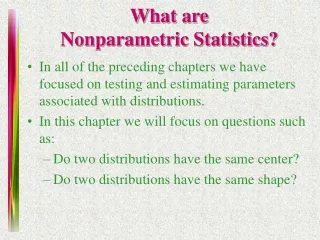
Nonparametric Statistical Methods • Nonparametric methods are used: • When the data are ranks for the subjects, rather than quantitative measurements. • When it’s inappropriate to assume normality.
Section 14.1 How Can We Compare Two Groups by Ranking?
Example: How to Get A Better Tan • Experiment: A student wanted to compare ways of getting a tan without exposure to the sun. • She decided to investigate which of two treatments would give a better tan: • An “instant bronze sunless tanner” lotion • A tanning studio
Example: How to Get A Better Tan • Subjects: • Five female students participated in the experiment. • Three of the students were randomly selected to use the tanning lotion. • The other two students used the tanning studio.
Example: How to Get A Better Tan • Results: • The girls’ tans were ranked from 1 to 5, with 1 representing the best tan. • Possible Outcomes: • Consider all possible rankings of the girls’ tans. • A table of possibilities is displayed on the next page.
Example: How to Get A Better Tan • For each possible outcome, a mean rank is calculated for the ‘lotion’ group and for the ‘studio’ group. • The difference in the mean ranks is then calculated for each outcome.
Example: How to Get A Better Tan • For this experiment, the samples were independent random samples – the responses for the girls using the tanning lotion were independent of the responses for the girls using the tanning studio.
Example: How to Get A Better Tan • Suppose that the two treatments have identical effects. • A girl’s tan would be the same regardless of which treatment she uses. • Then, each of the ten possible outcomes is equally likely. So, each outcome has probability of 1/10.
Example: How to Get A Better Tan • Using the ten possible outcomes, we can construct a sampling distribution for the difference between the sample mean ranks. • The distribution is displayed on the next page.
Example: How to Get A Better Tan • Graph of the Sampling Distribution:
Example: How to Get A Better Tan • The student who planned the experiment hypothesized that the tanning studio would give a better tan than the tanning lotion.
Example: How to Get A Better Tan • She wanted to test the null hypothesis: • H0: The treatments are identical in tanning quality. • Against • Ha: Better tanning quality results with the tanning studio.
Example: How to Get A Better Tan • This alternative hypothesis is one-sided. • If Ha were true, we would expect the ranks to be smaller (better) for the tanning studio. • Thus, if Ha were true, we would expect the differences between the sample mean rank for the tanning lotion and the sample mean rank for the tanning studio to be positive.
Wilcoxon Test • The test comparing two groups based on the sampling distribution of the difference between the sample mean ranks is called the Wilcoxon test.
Wilcoxon Nonparametric Test for Comparing Two Groups • Assumptions: Independent random samples from two groups.
Wilcoxon Nonparametric Test for Comparing Two Groups • Hypotheses: • H0: Identical population distributions for the two groups (this implies equal expected values for the sample mean ranks). • Ha: Higher expected value for the sample mean rank for a specified group (one-sided).
Wilcoxon Nonparametric Test for Comparing Two Groups • Test Statistic: • Difference between sample mean ranks for the two groups (Equivalently, can use sum of ranks for one sample).
Wilcoxon Nonparametric Test for Comparing Two Groups • P-value: One-tail or two-tail probability, depending on Ha, that the difference between the sample mean ranks is as extreme or more extreme than observed. • Conclusion: Report the P-value and interpret it. If a decision is needed, reject H0if the P-value≤ significance level such as 0.05.
Example: Does the UV Tanning Studio Give a Better Tan than the Tanning Lotion? • For the actual experiment: • the ranks were (2,4,5) for the girls using the tanning lotion • the ranks were (1,3) for the girls using the tanning studio.
Example: Does the UV Tanning Studio Give a Better Tan than the Tanning Lotion? • The mean rank for the tanning lotion is: (2+4+5)/3 = 3.7 • The mean rank for the tanning studio is: (1+3)/2=2
Example: Does the UV Tanning Studio Give a Better Tan than the Tanning Lotion? • The test statistic is the difference between the sample mean ranks: • 3.7 – 2 = 1.7
Example: Does the UV Tanning Studio Give a Better Tan than the Tanning Lotion? • The one-sided alternative hypothesis states that the tanning studio gives a better tan. • This means that the expected mean rank would be larger for the tanning lotion than for the tanning studio, if Ha is true. • And, the difference between the mean ranks would be positive.
Example: Does the UV Tanning Studio Give a Better Tan than the Tanning Lotion? • The test statistic we obtained from the data was: • Difference between the sample mean ranks = 1.7. • P-value = P(difference between sample mean ranks at least as large as 1.7)
Example: Does the UV Tanning Studio Give a Better Tan than the Tanning Lotion? • The P-value can be obtained from the graph of the sampling distribution (as seen on a previous page and displayed again here):
Example: Does the UV Tanning Studio Give a Better Tan than the Tanning Lotion? • P-value = 0.20. • This is not a very small P-value. • The evidence does not strongly support the claim that the tanning studio gives a better tan.
The Wilcoxon Rank Sum • The Wilcoxon test can, equivalently, use as the test statistic the sum of the ranks in just one of the samples. • This statistic will have the same probabilities as the differences between the sample mean ranks. • Some software reports the sum of ranks as the Wilcoxon rank sum statistic.
Example: Is there a treatment difference between the UV Tanning Studio and the Tanning Lotion? • Suppose the experiment was designed with a two-sided alternative hypothesis: • H0: The treatments are identical in tanning quality. • Ha: The treatments are different in tanning quality.
Example: Is there a treatment difference between the UV Tanning Studio and the Tanning Lotion?
Using the Wilcoxon Test with a Quantitative Response • When the response variable is quantitative, the Wilcoxon test is applied by converting the observations to ranks. • For the combined sample, the observations are ordered from smallest to largest. • The test compares the mean ranks for the two samples.
Example: Do Drivers Using Cell Phones Have Slower Reaction Times? • Experiment: • A sample of 64 college students were randomly assigned to a cell phone group or a control group, 32 to each. • On a machine that simulated driving situations, participants were instructed to press a “brake button” when they detected a red light.
Example: Do Drivers Using Cell Phones Have Slower Reaction Times? • Experiment: • The control group listened to the radio while they performed the simulated driving. • The cell phone group carried out a conversation on a cell phone. • Each subject’s response time to the red lights is recorded and averaged over all of his/her trials.
Example: Do Drivers Using Cell Phones Have Slower Reaction Times? • Boxplots of the data:
Example: Do Drivers Using Cell Phones Have Slower Reaction Times? • The box plots do not show any substantial skew, but there is an extreme outlier for the cell phone group. • Thetinferences that we have used previously assume normal population distributions. • The Wilcoxon Test does not assume normality. This test can be used in place of the t test if the normality assumption is questioned.
Example: Do Drivers Using Cell Phones Have Slower Reaction Times? • To use the Wilcoxon test, we need to rank the data (response times) from 1 (smallest reaction time) to 64 (largest reaction time). • The test statistic is then calculated from the ranks.
Example: Do Drivers Using Cell Phones Have Slower Reaction Times? • The next page shows the output for the hypothesis test: • H0: The distribution of reaction times is identical for the two groups. • Ha: The distribution of reaction times differs for the two groups.
Example: Do Drivers Using Cell Phones Have Slower Reaction Times?
Example: Do Drivers Using Cell Phones Have Slower Reaction Times? • The small P-value (.019) shows strong evidence against the null hypothesis. • The sample mean ranks suggest that reaction times tend to be slower for those using cell phones.
Example: Do Drivers Using Cell Phones Have Slower Reaction Times? • Insight: • The Wilcoxon test is not affected by outliers. • No matter how far the largest observation falls from the next largest, it still gets the same rank.
Nonparametric Estimation Comparing Groups • When the response variable is quantitative, we can compare a measure of center for the two groups. • One way to do this is by comparing means. • This method requires the assumption of normal population distributions.
Nonparametric Estimation Comparing Groups • When the response distribution is highly skewed, nonparametric methods are preferred. • For highly skewed distributions, a better measure of the center is the median. • We can then estimate the difference between the population medians for the two groups.
Nonparametric Estimation Comparing Groups • Most software for the Wilcoxon test reports point and interval estimates comparing medians. • Some software refers to the equivalent Mann-Whitney test.
Nonparametric Estimation Comparing Groups • The Wilcoxon test (and the Mann-Whitney test) does not require a normal population assumption. • It does require an extra assumption: the population distributions for the two groups are symmetric and have the same shape.
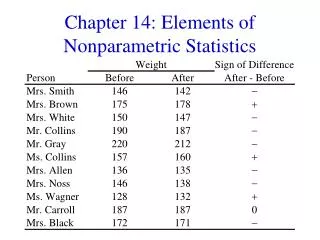
For a study on the effects of hypnosis, subjects were divided into a control group and treatment group and a measure of respiratory ventilations was taken on each subject. Controls: 3.99 4.19 4.21 4.54 4.64 4.69 4.84 5.48 Treated: 4.36 4.67 4.78 5.08 5.16 5.20 5.52 5.74 • What is the mean rank for the Control Group? • 8 • 49 • 6.125 • 7.5
For a study on the effects of hypnosis, subjects were divided into a control group and treatment group and a measure of respiratory ventilations was taken on each subject. Controls: 3.99 4.19 4.21 4.54 4.64 4.69 4.84 5.48 Treated: 4.36 4.67 4.78 5.08 5.16 5.20 5.52 5.74 • What is the mean rank for the Treatment Group? • 8 • 10.875 • 13.25 • 16
For a study on the effects of hypnosis, subjects were divided into a control group and treatment group and a measure of respiratory ventilations was taken on each subject. Controls: 3.99 4.19 4.21 4.54 4.64 4.69 4.84 5.48 Treated: 4.36 4.67 4.78 5.08 5.16 5.20 5.52 5.74 • A test of the hypothesis that subjects in the treatment group tended to ventilate more resulted in a P-value of 0.025. Does this P-value support the claim that subjects in the treatment group ventilated more? • yes • no
Section 14.2 Nonparametric Methods for Several Groups and for Matched Pairs
Comparing Mean Ranks of Several Groups • The Wilcoxon test for comparing mean ranks of two groups extends to a comparison of mean ranks for several groups. • This test is called the Kruskal-Wallis test.